Hotel Currents: Economics and Hotel Financial Performance
CBRE Hotels Research specializes in translating national and local economic conditions into measures of hospitality market and property-level financial performance now and into the future.
The Discretionary Income Squeeze on Leisure Travelers
Prepared for CBRE Hotels Research by Jack Corgel, Ph.D., Cordial Hotel Property Research
Key Takeaways
- Over the last 18 months, domestic leisure travel has been well above historical trends as guests were not afraid to travel and had accumulated considerable savings during the pandemic.
- Economic conditions have changed. Inflation is running ‘hot’ for many non-discretionary (i.e., necessities) items, which limits discretionary income for travel and lodging.
- Household earnings are not growing fast enough to offset Inflation, further limiting discretionary income.
- Price for airline tickets, gas for automobiles, and hotel room rates have risen at rates well exceeding CPI growth.
As individuals and households gradually began making trips again during the vaccination phase of the COVID pandemic, leisure travel became the bellwether of U.S. hotel financial performance. Leisure guests historically comprise about 55 percent of total hotel occupancy. Beginning in late 2020 until now, the contribution grew to 70-80 percent. Business transient and small group demand remains weak, and large groups are even further behind long-run average bookings.
A recent Bank of America lodging analyst publication (The leisure to business handoff: Can rebounding business offset “peak travel”? June 15, 2022) reports on investors’ concerns about how much longer leisure travelers will drive hotel occupancy and the strong average daily rate (ADR) growth experienced over the past 18-plus months. Concerns center around consumer income and deteriorating U.S. economic conditions, which includes high and persistent inflation, interest rate increases, and elevated travel fuel pricing. The Bank of America analysts estimate a 13-16 percent decline in leisure room rates, but business travel ‘normalization’ could offset this decline – hence the ‘handoff’ analogy. The recent strengthening of the U.S. dollar suggests that international guests now will be more disincentivized to resume traveling to the U.S.
This debate surrounding leisure travel stalling out and business travel picking up the slack will continue through 2022 and into 2023. The new question of interest is about the transitory nature of elevated levels of leisure travel. Differentiating between business and leisure travel within the data can be difficult because (a) travelers have not been consistently queried over time about why they made trips and (b) many trips have a dual-purpose.1 Imperfect proxy measures emerged, such as examining occupancy data for weekdays vs. weekends, high-end and low-end hotels, various location identifiers, and booking channels commonly used by corporate and leisure travelers. Without reliable time-series data (i.e., definitionally correct and covering several cycles) on trip purpose, CBRE Hotels Research and other industry analysts are unable to prepare objective, statistical forecasts for these important demand segments. In this blog, I take the economic temperature of individuals and households who have been making many leisure trips over the past two years in an effort to test the hypothesis that investors’ concerns about leisure travel peaking then declining2 are not correct. I often express the opinion that people travel ‘when they are not afraid, including getting stuck a long way from home, and have the money. As pandemic-induced travel fears are dissipating, having the money remains the important factor for continuation of heightened leisure travel.
Sentiment
University of Michigan Surveys of Consumers, including the Index of Consumer Sentiment extending back to 1960, is the gold standard of U.S. consumer attitudes regarding the economy and buying conditions. Results for June 2022 place the index at 50.0 (the July index is slightly higher). This is the lowest reading on record, lower than during any recession since the survey began. Only about one-half of the respondents to the May survey expected their incomes to rise faster than inflation. The other highly regarded consumer sentiment indexes sponsored by the Conference Board posted similar results and reported, among the June survey findings, ‘that vacation plans softened further as rising prices took their toll.
The Discretionary Income Squeeze
Income
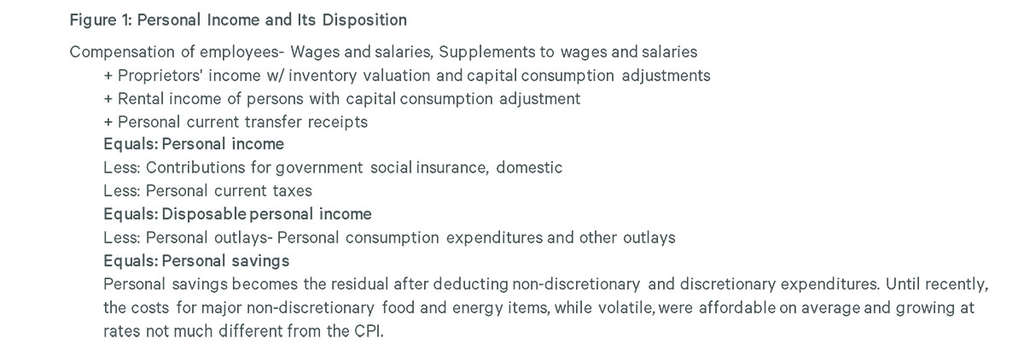
The Bureau of Economic Analysis (BEA) manages the National Income and Product Accounts (NIPA) providing detailed information on U.S. consumer economic wellbeing. Figure 1 presents a condensed version of the NIPA table accounting for consumer income and outlays. Note that disposable personal income less personal consumption expenditures yield personal savings. Federal data do not divide personal consumption expenditures into those for necessities or discretionary purchases because discretionary expenditures depend on a specific standard of living which varies widely across the U.S. consumer population.3 Other Federal government reports present data on various expenditure types, such as durables and non-durables, but extracting discretionary purchase information remains problematic. Thus, the income available for discretionary purchases such as leisure travel cannot be readily determined in the aggregate from generally available sources.

Consumers’ income situations changed due to the pandemic. Some noteworthy personal income abnormalities that occurred between the end of 2019 through the end of 2021 as measured in the NIPA data (nominal) include:
- Total employee compensation increased 10.0% while transfer payments (mostly from government) grew 46.6% and the ‘other’ category within transfers expanded 172.1%. The growth in other transfers were likely dominated by payments to individuals authorized in Congressional COVID relief bills passed during the period.
- The long run average growth rate "LRA" (1970-2021) in disposable income equals 6.3%. From Q1 2021 to Q1 2022 the growth rate was -6.2%.
- The LRA (1970-2021) personal saving rate (i.e., personal savings/disposable income) equals 8.47%. In 2020 and 2021 it went up by 16.6% and 12.3%, respectively. During Q1 2022 it declined below the LRA, equaling -5.6%.
Government transfer payments enhanced consumers’ ability to purchase goods and services during 2020 and 2021. These receipts not only affected non-discretionary and discretionary expenditures through increases in disposable income but also contributed to personal savings. Most consumers also saved more during the period due to pandemic-related constraints on discretionary purchases such as travel and restaurant meals. With transfer payments tailing off, disposable income available for near-term expenditures is declining (see the second bullet point above). In addition, the reduction in the personal saving rate during Q1 and Q2 2022 may be an indication of a trend in consumers’ abilities to fund future purchases from wealth accumulation.
Inflation
Consumers might ‘hold serve’ by adjusting to economic life without COVID relief checks. Hypothetically, personal incomes could grow at or above LRA from wage gains in this tight labor market and the personal saving rate could mean revert. Unfortunately, the inflation rate coming out of the pandemic well exceeds that prior to the pandemic. Importantly for sustaining high levels of leisure travel and hotel financial performance, the inflation figures for non-discretionary items exceed those for most other items by a wide margin.
Figure 2 presents selected inflation data from April through June of 2022. The average rate for all items during this period was 8.7% while coincidentally the rates of price increases for food (10.0%), energy (35.5%), and used cars and trucks (15.3%) outdistanced price movements for other items on average. Fuel, oil, and gasoline prices encountered by consumers at frequent intervals were up an extraordinary 95.2% and 50.7%, respectively. Core inflation which excludes food and energy has been running over 2.5% below the all-items rate which is still high by historical standards.


Discretionary Income Squeeze #1 – The costs of non-discretionary items are skyrocketing, leaving much less personal income available for discretionary expenditures than before and during the pandemic.
If wage growth rates keep up with the pace of non-discretionary item price increases consumers should feel comfortable spending on discretionary items. Yet the bottom section of Figure 2 shows that consumer income growth from earnings averaged 4.3% over the past three months, woefully lagging general inflation and particularly price growth of non-discretionary items.4
Discretionary Income Squeeze #2 – Consumers’ earning increases lag CPI and the growth rates of non-discretionary goods and services prices by large margins.
Perhaps consumers find the costs of travel low enough that despite the squeezes on discretionary income, sufficient amounts of money will be available to make leisure trips. Unfortunately, price increases for air travel averaged 35.1% over the past three months, 16.3% for lodging away from home, and 7.4% for food away from home (Figure 2).
Wealth to the Rescue?
In a June 13 article in Financial Times, James Gorman, chief executive of Morgan Stanley, stated a popular view among economists “…investors were forgetting that consumer and corporate balance sheets remain ‘very strong’ following government stimulus during the coronavirus pandemic and years of cheap borrowing.” This observation implies that consumers will continue to take some leisure trips despite pressures on incomes and the specter of recession because of their strong wealth positions today, assuming unemployment remains in check and balance sheets remain strong during the remainder of 2022 and in 2023.
Household balance sheets indeed were strong through Q1 2022. The net worth of households in the U.S. at the end of Q1 2022 exceeded $141 trillion, a near record level. In nominal terms, household net worth was 9.2% above that during Q1 2021. Yet as indicated in Figure 3, households experienced a slight decline (about one half $ trillion) in net worth from Q4 2021, mostly due to a reduction in the value of securities portfolios. Consumer balance sheets shed light on inflation and recession, and in turn the sustainability of current household wealth positions.


Household balance sheets are asset heavy and liability light. Financial assets comprise more than 70 percent of the total. About 13 percent of financial assets are highly liquid cash or near cash components while most of the remainder include securities held in households’ portfolios and pension accounts. While households will benefit from interest rate increases in CDs and other interest-bearing accounts, their security portfolios will decline in value. Withdrawals of liquid assets for discretionary expenditures will be subject to the same extreme purchasing power losses as earnings due to high inflation. Recession fears of job losses could incentivize households to maintain large asset cushions.
Closing Remarks
Consumers’ economic health appears to be eroding from the ‘sugar high’ brought about by COVID-related stimulus. Logically, a continuation of extraordinarily high inflation centered on non-discretionary items will increasingly make a dents in discretionary spending. Historically high levels of leisure travel might survive these blows to disposable income if the costs of travel and paid accommodations, like non-discretionary items, were not accelerating at rates well above the CPI. But they are! In addition to securities price declines, the COVID relief phase out and high inflation likely caused household net worth to contract during Q1 2022.
Offsetting the risks above, there exists the following positive scenario for the continuation of elevated levels of leisure travel:
- Remote work does not revert to the pre-pandemic state. This means ‘bleisure’ travel will sustain hotel occupancy regardless of the trip purpose. Households continue to relocate to less expensive areas freeing up money for travel.
- Inflation subsides quicker than the expectation for any number of reasons – a cease fire in Ukraine, supply chain issues are resolved, the Federal Reserve actions quickly take hold, fiscal restraint prevails in Congress.
- The upcoming recession fizzles such that the number of job openings continue to exceed available workers. This means the gap between the inflation rate and wage growth disappears.
- The direction of consumer net worth changes reverses because security prices rebound.
1 See Sean McCracken, “Hotel Guests Continue to Blend Business and Leisure Trips, Regardless of Destination Type” Hotel News Now, July 11, 2022. 2 The null hypothesis – the level of domestic leisure travel won’t change. 3 Economist sometimes assume a standard of living of 150 percent of the poverty level for research and modeling purposes. 4 Other BLS series show similar results.
Jack Corgel
Senior Advisor - PKF Hospitality Research
+1 678 910 4816
CBRE Hotels