Market Recovery Monitor - 16 April 2022

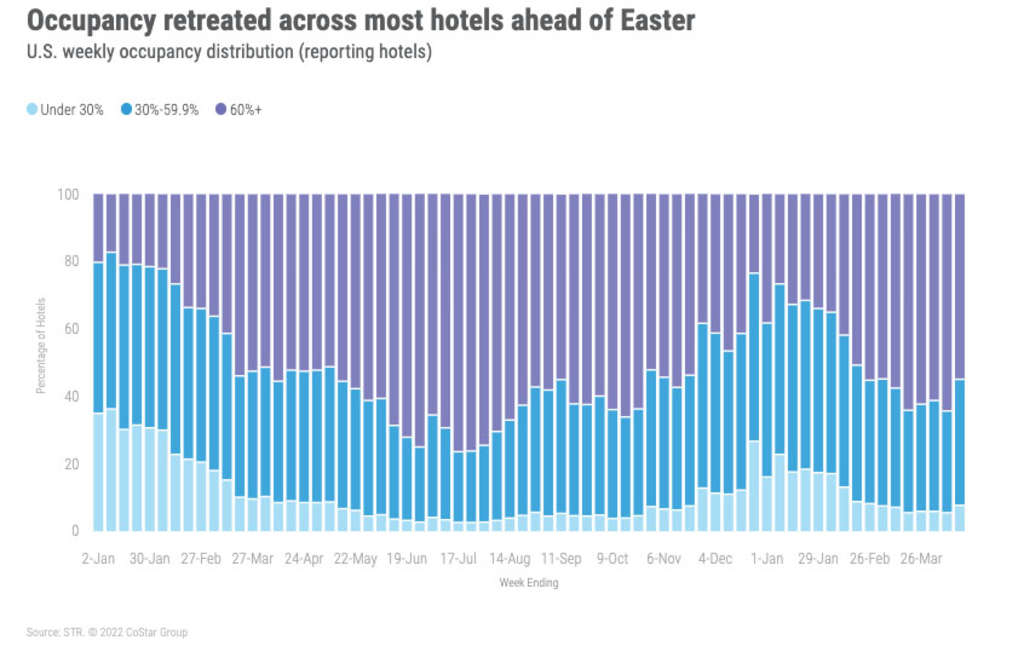
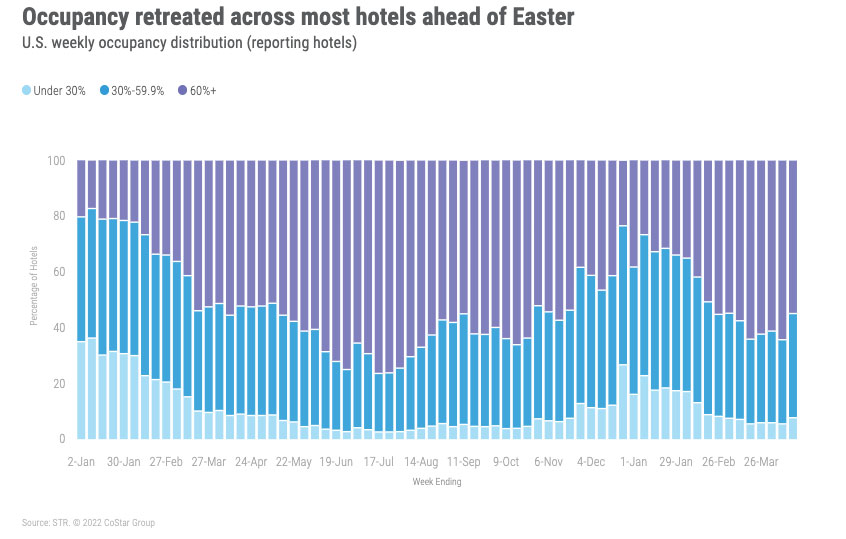
Occupancy tends to fall ahead of Easter, and this week was no exception. TSA security screenings were the second highest since the beginning of the pandemic, behind the high seen in the week ending 19 March. In that week, occupancy reached 66.8%, among the highest of the pandemic era, with TSA security screenings just 29,000 higher than this past week. Taking a closer look at how this week compared with 2019, the gap by day parts (weekday, weekend and shoulder) were uneven at best. Most of the week’s gap deterioration occurred on the shoulder days, with the 2019 occupancy index falling by 1.5 points week on week to 96.6. The index for weekdays was nearly flat week on week (-0.1 points), while the weekend fell 0.7 points. Even with the small decrease, weekday occupancy was about 10 percentage points lower than what it was in 2019 while the weekend was less than two percentage points away from the 2019 level. Putting these two items together (TSA screenings and occupancy gap), it is likely that this week is more of a “stay with family week,” suggesting less usage of traditional hotels and increased use of alternative accommodations that can house large family gatherings.
Group demand accounted for most (61%) of the total demand decrease for the week with the largest portion of the decline coming on the weekend. Weekday group demand was also down but made up less than one-fifth of the total group demand decrease. Transient demand fell the most on the weekend with weekday transient demand increasing.
While no STR-defined market set pandemic-era occupancy records this week, two markets, New York City (81.3%) and San Francisco (69.3%) saw their second highest weekly occupancy to date. The Florida Keys (86.3%) regained the nation’s top spot in occupancy this week followed by New York City. This was NYC’s first time in the top 10 this year. The composition of the top 10 occupancy markets was also different from what had been seen for most of the year as only two Florida markets were included (Florida Keys and Miami).
Weekday occupancy (63.2%) held up relatively well with occupancy falling by less than a point as New York City, Anaheim/Santa Ana, Baltimore, and Bergen/Passaic, NJ reported their highest weekday occupancy since the start of the pandemic. Six other markets, including San Francisco (75.2%) and Washington, D.C. (65.8%) saw their second highest weekday occupancy since March 2020. Overall, Top 25 weekday occupancy was the second highest since the start of the pandemic at 68.7%, up 0.3 percentage points in the week.
Occupancy in central business districts (CBDs) fell by its largest amount of the year (-4.6 percentage points) to 65.4% with the largest decrease in shoulder (-6.2 percentage points) and weekend (-5.7 percentage points) days. Weekday occupancy fell 2.9 percentage points to 64.2%. This was the fifth consecutive week that weekday occupancy had been above 60% among the CBDs, which is the longest stretch of the pandemic-era. Atlanta (66.9%), Nashville (82.7%), and the New York Financial District (83.1%) saw their second highest weekday occupancy since March 2020.


Like occupancy, ADR fell the most over the weekend (-3.5%) followed by shoulder days (-1.9%). Weekday ADR was nearly flat (-0.9%) week on week. Overall, the week’s ADR was the fifth highest since the start of the pandemic and 14% higher than what it was in the same week of 2019. Weekly ADR has been above 2019 levels for the past 10 weeks. Additionally, ADR on an inflation-adjusted basis (real) also surpassed 2019 levels by 1.3%. This was only the fourth time over the past 10 weeks where real ADR was above 2019. Eighty-one of the 166 STR-defined markets surpassed 2019 on a real basis. Top 25 Market ADR also showed less of a decrease than the nation as a whole (-1.5%) with Top 25 Market ADR the third highest of the pandemic-era. However, weekday Top 25 Market ADR (US$175) was the highest since March 2020, up slightly from the previous week.
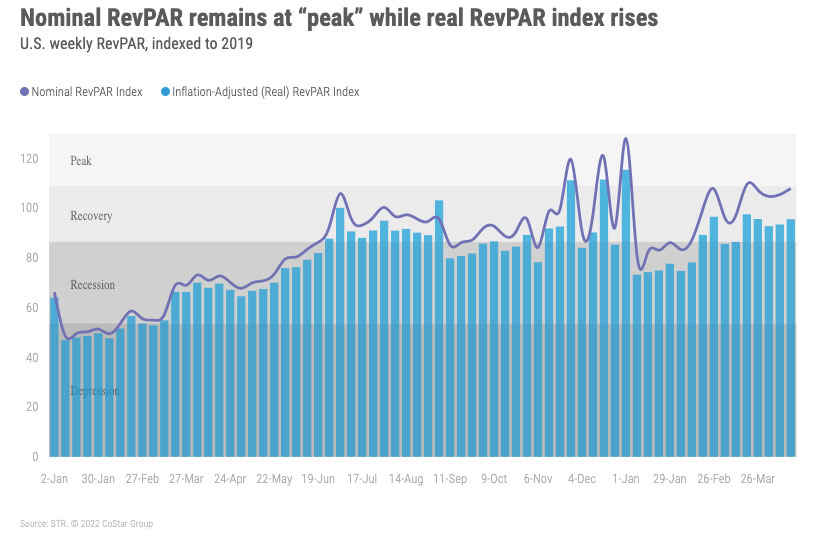
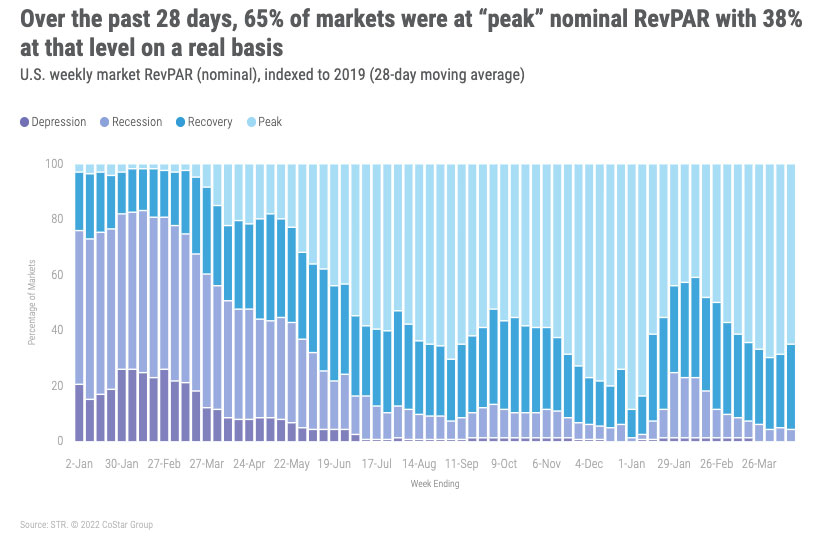
Even though actual RevPAR decreased week on week, the index to 2019 rose for a second consecutive week with this week’s RevPAR 8% higher than what it was in 2019. Most (73%) markets reported their weekly RevPAR above 2019 comparables with 37% seeing a similar result on a real basis. Top 25 RevPAR fell 5.7% week on week with the largest decrease occurring over the weekend (-12.6%). Weekday Top 25 RevPAR increased 0.4% with the week’s RevPAR (US$120) the highest of the pandemic era.


Around the Globe
Outside of the U.S., occupancy increased 2.8 percentage points week over week to 55.9%. ADR rose 7.1% to US$131, resulting in a robust RevPAR increase (+12.6%). Thirty-eight of the countries tracked on a weekly basis saw a week-over-week drop in occupancy, a notable improvement compared with last week. Monaco saw a significant increase in occupancy and ADR, up 26.8 percent points and 29%, respectively, driven by the Monte-Carlo Masters tennis tournament.
The positive impact of Easter holidays was seen across holiday destinations with week-over-week occupancy increases of more than 10 percentage points across many markets, including Croatia, Portugal, Greece, Maldives, and Egypt. China occupancy levels continued to recover, up 3 percentage points from the previous week. Puerto Rico once again achieved the highest weekly occupancy in the world at 82.8%, followed by Curaçao at 80.1%. Northern Europe saw the highest occupancy (72.8%) of any sub-continent with Northern Africa with the lowest (40.6%).
From a market perspective, we saw that leisure destinations came out on top this month. The Thailand South and Thailand Central & North markets reported strong occupancy growth from the previous week, around 20 percentage points for both. European destinations Andorra, the Baltic Coast, Andalusia, and Algarve also saw strong occupancy gains.
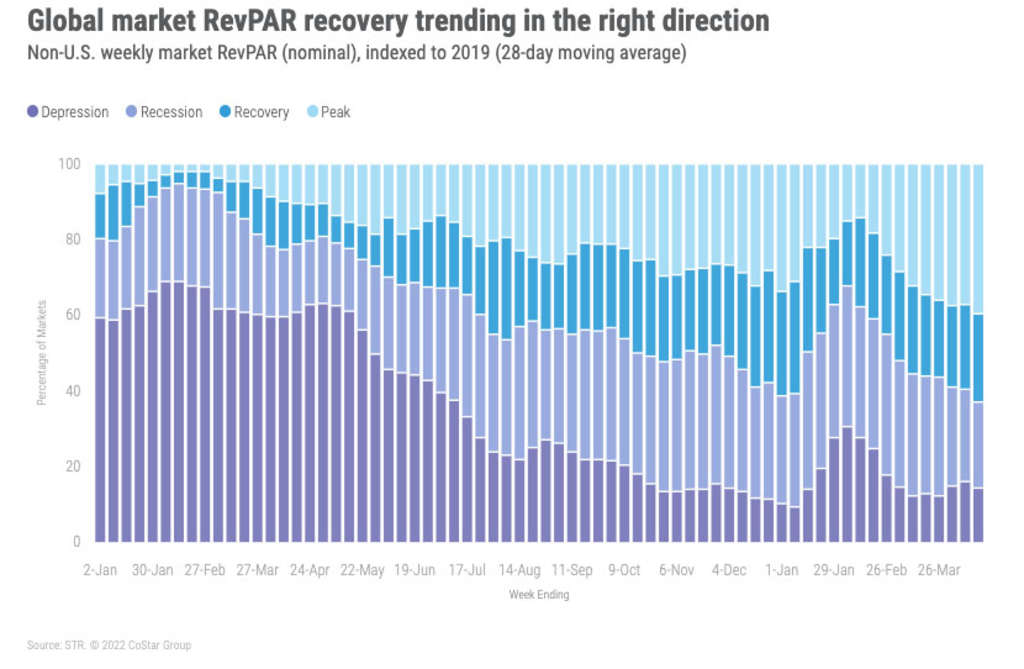
Over the past 28 days, 23% of non-U.S. markets remained in “Recession” (RevPAR indexed to 2019 between 50 and 80) with another 14% in “Depression” (RevPAR indexed to 2019 under 50). This was a slight improvement on last week’s performance.

The Big Picture
The decrease in this week’s U.S. performance is on par for Easter week even though we expected less of an impact given the high daily TSA screening numbers. The most surprising result was the lower decrease in weekday performance, which continues to provide optimism for the recovery of business demand. We were also slightly astonished on how group weekend demand impacted total group performance. We surmise that fewer weddings and the like occurred over the weekend given the confluence of the three major religious holidays falling over the same period. We should expect performance to dip again in the next week of data then resume a seasonal climb in the last week of April.
About STR
STR provides premium data benchmarking, analytics and marketplace insights for the global hospitality industry. Founded in 1985, STR maintains a presence in 15 countries with a corporate North American headquarters in Hendersonville, Tennessee, an international headquarters in London, and an Asia Pacific headquarters in Singapore. STR was acquired in October 2019 by CoStar Group, Inc. (NASDAQ: CSGP), the leading provider of commercial real estate information, analytics and online marketplaces. For more information, please visit str.com and costargroup.com.