Market Recovery Monitor - 16 July 2022
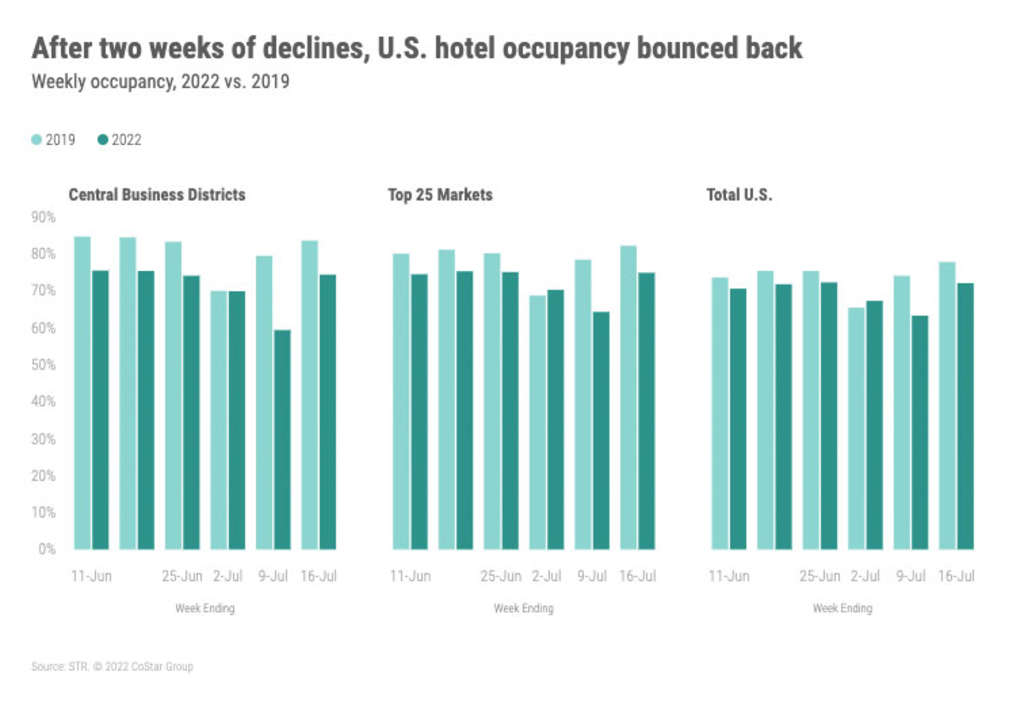
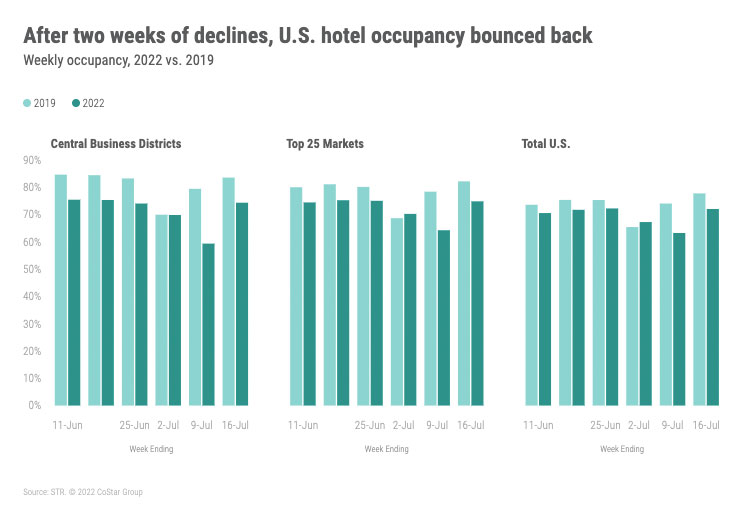
As anticipated, history indeed repeated itself during the week ending 16 July 2022, as demand rose 3.4 million rooms year over year – the second-largest gain for week 29 since 2000, and 210,000 less rooms than the 2016 record holder. Additionally, at 28.2 million rooms, this week’s demand was the fourth highest for week 29 since STR began benchmarking weekly demand in 2000. The highest demand for the week was posted in 2019 at 29.6 million rooms. Lifted by the strong demand, weekly occupancy rose to 72%, up 1.2% compared to last year and 93% of the comparable 2019 level. Nominal weekly average daily rate (ADR) advanced by 2.3% week over week to US$157 – the third-highest level on record. Nominal weekly revenue per available room (RevPAR) attained its second-highest level ever (US$113), which was US$0.41 below the record seen during the week ending 25 June 2022.
So what changed? Weekdays – likely from increased business travel along with the summer base of leisure travel. Most (81%) of the week-on-week demand was seen Monday-Wednesday with one-third of the weekday demand coming from the Top 25 Markets. Additionally, weekday demand was the highest of the pandemic so far and the highest since early August 2019. For the Top 25, weekday demand and occupancy were the second highest of any week since the start of the pandemic. Top 25 weekday occupancy ranged from 91% in San Diego to 51% in New Orleans. Nine markets including Boston, Chicago and New York City were above 80% for those three days. Another ten markets had weekday occupancy between 70% and 80%. Along with the strong occupancy, six markets, including Atlanta, Minneapolis, Philadelphia, and San Diego, saw their highest weekday demand since the start of the pandemic. For the entire week, demand for the Top 25 Markets was the third highest of the pandemic-era, driving occupancy to 75%.
Central business districts (CBDs) also saw a rise in occupancy during the week to 74%, with the measure reaching 77% during the weekdays (third highest of the pandemic-era).
Group demand also rebounded in the week with the measure at 1.8 million rooms among Luxury and Upper Upscale hotels. Absolute group demand was the sixth highest since the start of the pandemic, with weekday group demand coming in eighth place. Like total demand, the gain in group demand was centered on weekdays, which accounted for 68% of the week-on-week increase.
The week was particularly strong for Upscale and Upper Midscale hotels, which saw their highest demand ever for week 29. More importantly, for Upper Midscale hotels, this week’s demand (6.3 million) was the largest ever recorded by STR for any single week since 2000. For Upscale hotels, this week’s demand was the second best behind the high-water mark attained four weeks ago. Demand was also somewhat robust for Luxury and Upper Upscale hotels but to a lesser extent as they observed their sixth highest demand for week 29.
Looking at the seven weeks of summer so far (29 May – 16 July), room demand is the fourth highest since the start of weekly records, with an average occupancy of 69%. The highest demand ever recorded for this portion of the summer was 195 million rooms in 2019 versus 188 million this year.
While this summer has not materialized as the “summer of summers,” for the entire industry, some markets have experienced that feeling. Those markets that have seen their highest summer demand to date include Atlanta, Austin, Charlotte, Dallas, and Nashville. In total, 17 of the 166 STR-defined markets have had the “summer of summers!” Taking a further look at the Top 25 Markets, Denver and Orlando
have had their second-best summer so far. New York City has not performed too badly either, with the market seeing the fifth-highest summer demand on record. The Top 25 Market that is furthest away from reaching a record is San Francisco, where the current summer demand ranks 19th of the pass 22 years.
Nominal ADR for the week was 15% higher than in the same week of 2019 and 12% higher than a year ago. While this week’s nominal ADR was only the third highest since 2000, it is fascinating to see that the top 10 highest nominal ADRs of all time have occurred in 2022, with six of them occurring since the start of the summer. Real (inflation-adjusted) ADR reached US$138, its fourth best for week 29 and the 16th highest of all time. Among the markets, only two saw real ADR reach a record high: Montana and Washington State. Record real ADR was still elusive for most of the Top 25, except Orange County (Anaheim) which saw its third highest real ADR of all time for the week.
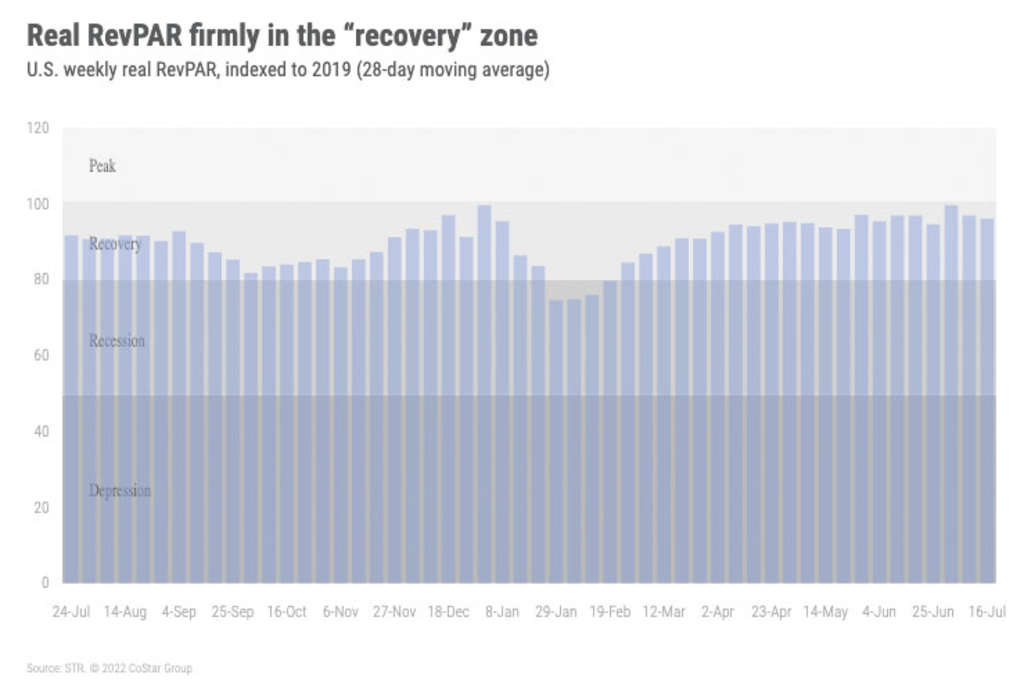
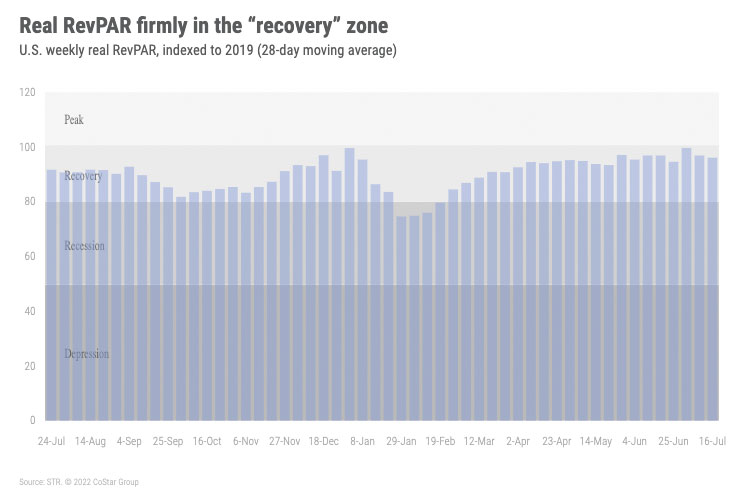
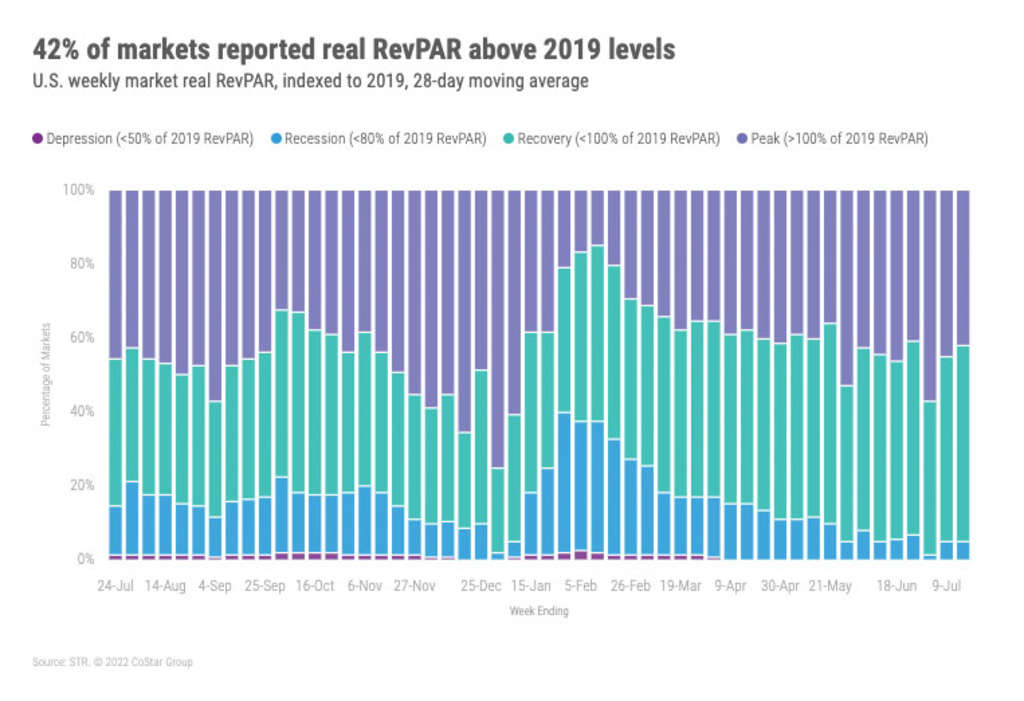
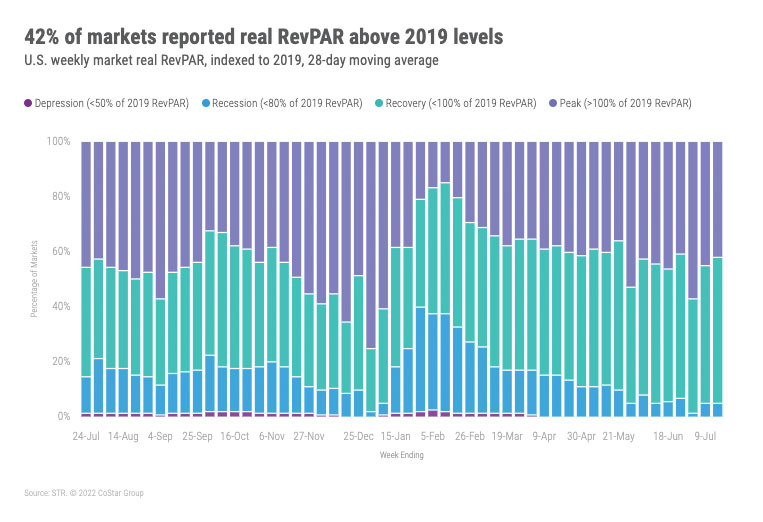
After falling below 2019 levels last week, nominal RevPAR rose 16% week over week and 14% compared to last year, topping the 2019 comparable week by 6%. Weekly nominal RevPAR was the highest of any week 29 before it but real RevPAR was ranked 6th versus all previous week 29s. As compared to all weeks since 2000, nominal RevPAR was the 16th best, with real RevPAR in 43rd place. Fourteen markets, however, did report their highest weekly nominal RevPAR of all time, including San Diego. Among the markets, 78% had a nominal RevPAR level above the comparable week in 2019, with 36% hitting that mark when look at real RevPAR. Looking at the past 28 days, 87% of markets were above 2019, with 42% having the same result via real RevPAR.
Around the Globe
Outside of the U.S., week-over-week occupancy increased 1.9 percentage points to 67.8%. This is 7.3 percentage points behind the comparable week in 2019, but an improvement on last week’s performance. ADR also increased 1.5% to US$144, which is 16.9% ahead of 2019 levels, driven by strong demand recovery and inflationary impact. Twenty of the countries tracked on a weekly basis saw a week-over-week drop in occupancy.
Egypt reported a 13.5 percentage-point increase in occupancy compared to the previous week, coupled with a 19.6% uptick in ADR. The country had been hit hard by the war in Ukraine as a large proportion of visitors to the country come from Ukraine and Russia. There were talks of increasing flights from Russia to Egypt and implementing easier payment systems for Russians, which may have contributed to the performance boost.
European Congress of Radiology (ECR) took place last week, boosting performance in Vienna. Occupancy levels increased 14.4 percentage points, while ADR saw a stellar growth of 29.6%.
Ireland and the U.K. continued to report robust occupancy levels at 86% and 84%, respectively, both sitting just 0.4% behind the 2019 comparable. Northern Europe again saw the highest occupancy (83%) of any subcontinent, up one percentage point compared to last week, while Southern Africa saw the lowest level in the metric (55%).
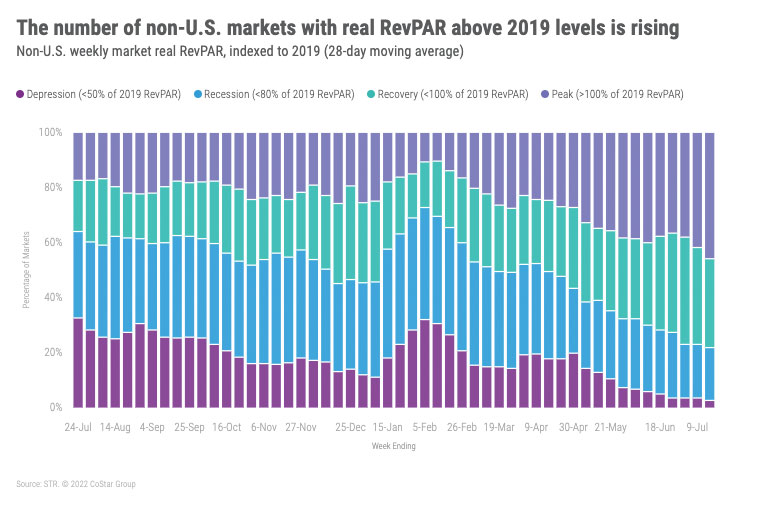
Over the past 28 days (using nominal RevPAR), 13% of non-U.S. markets remained in “Recession” (RevPAR indexed to 2019 between 50 and 80), while 2% were in “Depression” (RevPAR indexed to 2019 under 50). Using real RevPAR, 46% of markets were above 2019 over the past 28 days with another 32% in “Recovery” (RevPAR indexed to 2019 between 80 and 100).
Big Picture
The industry is heading to its yearly apex, which should occur the week ending 23 July 2022 (week 30). In 15 of the past 22 years, the highest demand levels have been attained in week 30, and given the results of this past week, we expect the same next week. After that, demand will soften, but that is a normal seasonal pattern as several schools in southern U.S. are set to begin in early August. It’s important not to read too much into the seasonal fall in demand. We continue to hear from several clients of a solid Q4, a sentiment echoed by Delta’s CEO a week ago. We agree that some individuals are not traveling because of travel hassles and its high costs, but we believe the expected decrease in August demand versus July is more a function of the industry’s normal ebb and flow versus a change in the environment.
About STR
STR provides premium data benchmarking, analytics and marketplace insights for the global hospitality industry. Founded in 1985, STR maintains a presence in 15 countries with a corporate North American headquarters in Hendersonville, Tennessee, an international headquarters in London, and an Asia Pacific headquarters in Singapore. STR was acquired in October 2019 by CoStar Group, Inc. (NASDAQ: CSGP), the leading provider of commercial real estate information, analytics and online marketplaces. For more information, please visit str.com and costargroup.com.
