Market Recovery Monitor - 24 September 2022

U.S. hotel industry occupancy topped 70% for the week ending 24 September 2022—an eight-week high. Weekday (Monday-Wednesday) demand and occupancy improved with the measures increasing to the highest levels since the summer. The Top 25 Markets saw weekday occupancy reach 75.7%, which was the second-best level since the start of the pandemic and the highest non-summer mark. Full-week nominal average daily rate (ADR) increased to US$158, up 1.4% week over week (WoW) and 17.6% from a year ago. Weekly nominal revenue per available room (RevPAR) improved to US$111, a 2.1% WoW gain and 30.3% increase from a year ago. On an inflation-adjusted basis (real), ADR was above 2019 for a second consecutive week whereas RevPAR was just below the value seen three years ago.
Room demand increased as anticipated and surpassed the level seen in the comparable week of 2019 for a second consecutive week. In the previous week, the week-on-week demand gain came almost entirely from weekdays. This week, the growth was in shoulder days (Sunday & Thursday), with most of the increase coming on Sunday, which accounted for 71% of the total week’s growth. The Sunday gain was widespread as 67% of markets saw demand increase that day versus an average of 50% on the remaining days. Weekday demand was relatively flat with gains seen on Monday and slight decreases on Tuesday and Wednesday.

Seventy percent of the week’s demand gains came from the 61 largest markets based on supply, led by Orlando, which accounted for 26% of the week’s total demand gain. Other markets that saw significant weekly gains included Charlotte, Dallas, New York City, and Washington, D.C. On the weekdays and among the Top 25 Markets, demand gains were seen in Anaheim, NYC, Phoenix, and Washington, D.C. New York, which hosted the United Nations General Assembly, and San Francisco with Salesforce’s Dreamforce conference, both saw weekday occupancy top 93%. The latter was the largest group event in San Francisco since the start of the pandemic. Seventeen of the Top 25 Markets saw weekday occupancy at or above 70% with nine markets above 80%.
After achieving a pandemic-era high a week earlier, weekday occupancy in central business districts (CBDs) fell to 78.6% from 79.1%. The New York Financial District, Seattle CBD and Washington, D.C. CBD reported occupancy above 90% with all but five of the 20 CBDs above 70%.
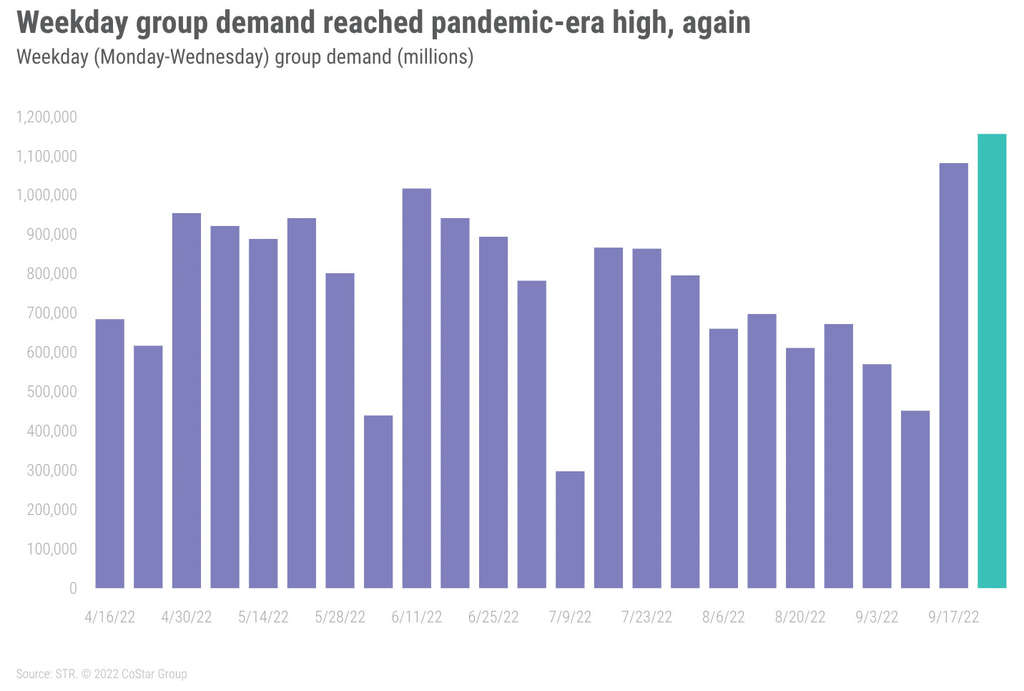
Group demand (all chain scales) was a significant driver of performance again this week, accounting for 32% of the total demand growth week over week. Additionally, Group accounted for nearly all the growth in weekday demand as transient declined week over week. Contract also added a bit to the gain in weekly demand. Looking specifically at the hotels that cater to large group events, Luxury and Upper Upscale hotels, weekday group demand was the highest since the start of the pandemic and ranked 20th all time. Group demand by market increased the most in San Francisco, New York City and Dallas. Chicago and Boston saw significant week-on-week decreases, but both markets retained solid occupancy for the week (81% and 71%, respectively).
With group a major driver of the week’s demand growth, it was not surprising that Upper Upscale had the highest weekday occupancy of any chain scale (79.4%) followed by Upscale (78.2%). Upper Midscale, the largest branded chain scale, saw weekday occupancy surpass 73%. For the full week, four of the seven chain scales (Luxury, Upper Upscale, Upscale and Upper Midscale) had occupancy above 70%. The remaining three were in the 60s with Economy the lowest (62.3%).
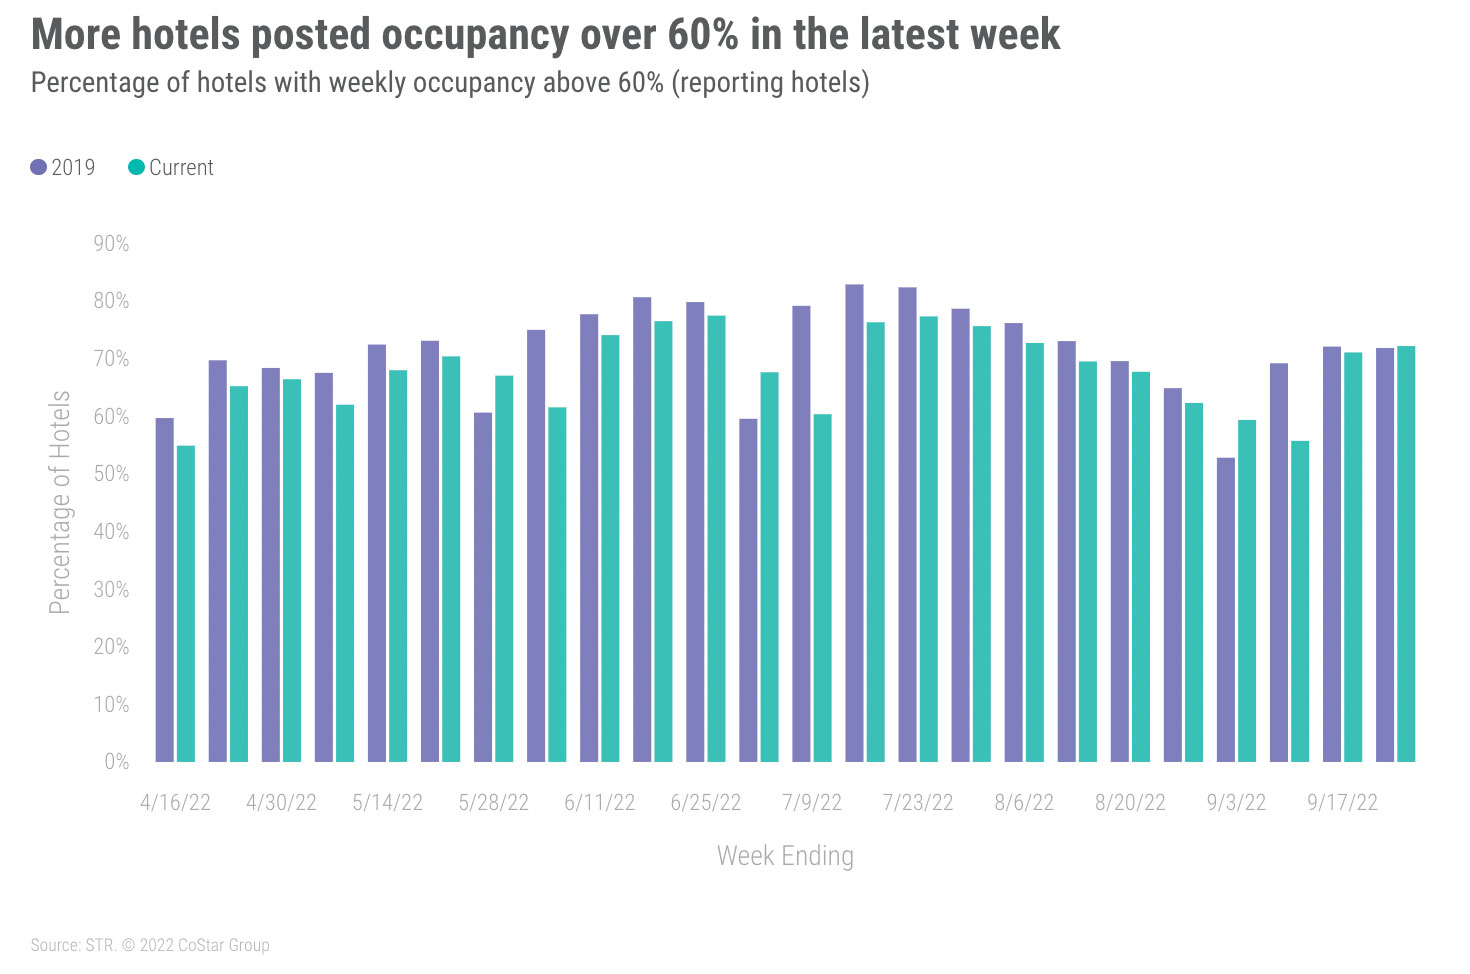
The weekend (Friday & Saturday) also produced solid demand growth, making up about a quarter of the week’s demand increase with occupancy rising to 77.3%. Most markets (80%) saw weekend occupancy above 70% with a third reporting the measure at or above 80%. Weekend occupancy has been above 2019 levels in six of the past eight weeks and in 22 of the 39 weeks of the year so far.

The week’s ADR growth (1.4% WoW) was led by San Francisco, where it increased by 37% WoW. Thirteen of the 166 STR-defined markets reported ADR growth of 10% or more week over week including Charlotte, Oakland, and New York. In NYC and San Francisco, several submarkets saw significant ADR increases associated with the large-scale events held in both cities. San Francisco Market St increased by more than 53% WoW with nominal ADR surpassing US$400. New York Midtown East was up 43% WoW with nominal ADR at US$655. With a nominal ADR of $689, up 24% WoW, New York Uptown had the nation’s highest level for the week. All but four of the 15 submarkets in New York and San Francisco saw real (inflation-adjusted) ADR advance to a pandemic-era high.
With strong growth in New York and San Francisco, Top 25 weekly ADR increased by 3.8% WoW and 29% year on year. Real ADR for the Top 25 neared 2019 with this week at 98%. Weekly Top 25 real ADR has only surpassed 2019 four times this year. On the weekdays, the Top 25 saw weekday ADR increase by 7.4% WoW led by New York and San Francisco.
College football propelled weekend ADR in many submarkets including Athens, GA, Norman, OK, Lansing, MI, Lubbock, TX, and Tallahassee, FL, where ADR increased by 50% or more week on week with nominal weekend ADR above $225. Overall weekend ADR for the total U.S. decreased 1.9% to US$167. Real weekend ADR fell to US$144 but remained above 2019 as it has since spring.
Nominal U.S. weekly RevPAR rose 2.1% WoW to US$111, with the level remaining ahead of 2019 as it has for most of this year. Real RevPAR remained right under 2019, but the gap lessened. Among markets, 90% had nominal RevPAR above 2019 for the week but only 54% of markets were above 2019 when considering inflation. Top 25 Markets with weekly real RevPAR above 2019 included Atlanta, Orlando, Phoenix, and San Diego. Overall, the Top 25 Markets saw weekly real RevPAR at 94% of 2019. Over the past 28 days, 49% of markets had real RevPAR above 2019, up from last week’s measurement. Among the Top 25 Markets, eight had real RevPAR surpassing 2019 over the past 28 days with the aggregate measure for all 25 at 91% of 2019. Weekday Top 25 real RevPAR was at 81% of 2019.


Around the Globe
Global occupancy excluding the U.S. increased to 68% from 66% a week prior and has grown for four straight weeks. Even with the increase, occupancy remained below 2019 with this week gap at 6.2 percentage points. Nominal ADR growth, however, slowed, increasing by only 0.3% WoW. With the solid growth in occupancy, nominal RevPAR advanced 3.7% WoW to US$98, which was the highest level of the past five weeks.


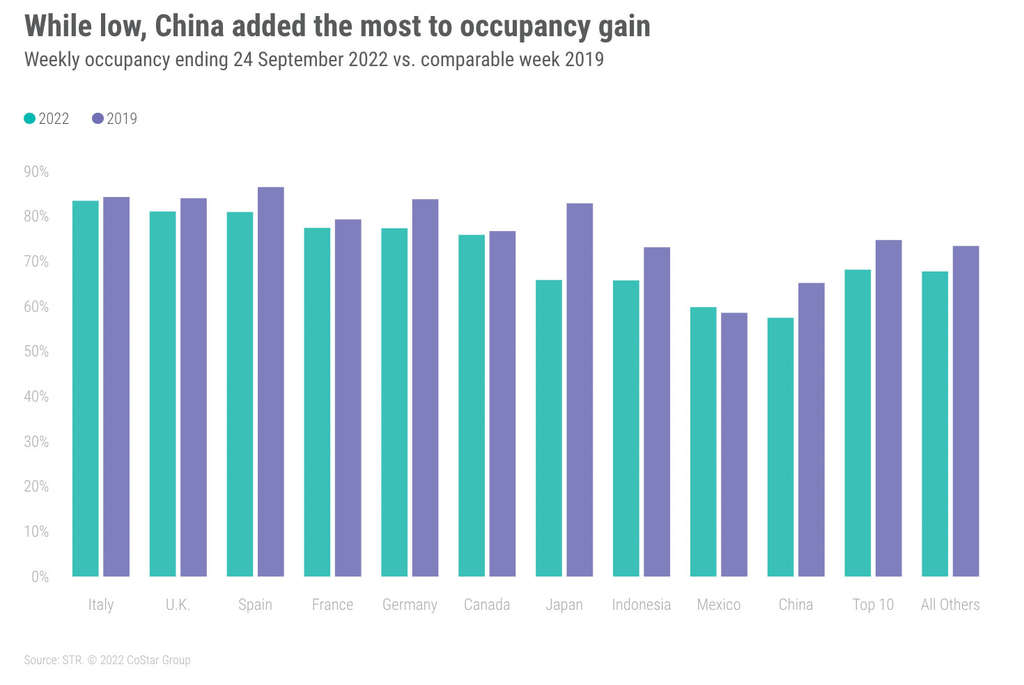
Occupancy in the top 10 countries based on supply, ranged from 83% in Italy to 57% in China. Like in the previous week, China was a significant boost to global occupancy as the country’s level increased 7.7 percentage points WoW and accounted for 79% of the total weekly demand increase seen outside the U.S. China’s occupancy of 57% was its highest level of the past four weeks. The U.K. saw occupancy of 81%, down slightly from the previous week, which saw an increase in London for the state funeral. Occupancy in London remained above 83% for a second consecutive week.

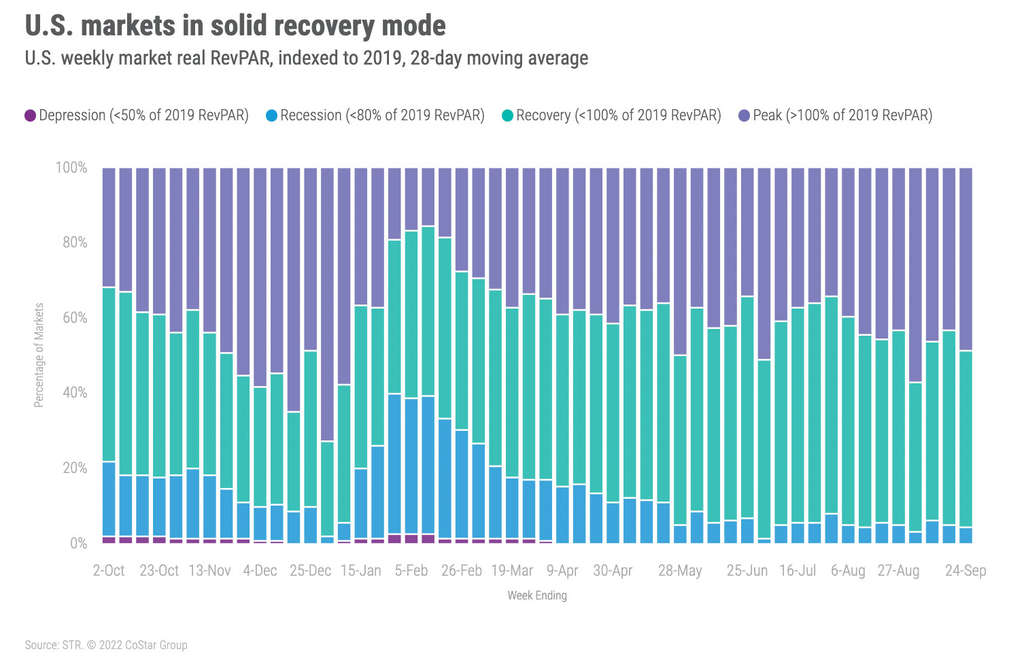
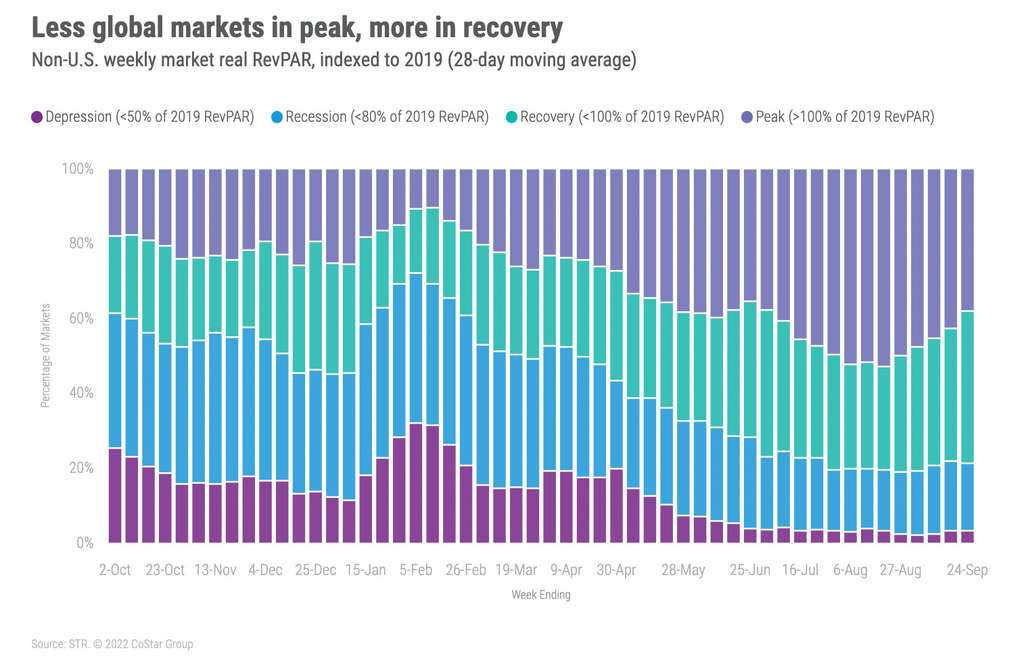
Dublin continued to see the world’s highest occupancy (93%) followed by Lisbon (90%) and Vancouver (89%). Even though nominal RevPAR advanced week on week, the gap to 2019 widened and fewer markets of the 344 tracked weekly were categorized as being at “peak” real RevPAR (RevPAR above 2019). The percentage of markets in Peak fell to 38% from 43% a week prior using a 28-day moving average. The percentage in "recovery” (real RevPAR between 80% and 100% of 2019) increased to 41% from 35% in our last report. The good news is the percentage of markets in “recession” (real RevPAR between 50% and 80% of 2019) and in “depression” (Real RevPAR below 50% of 2019) was relatively unchanged.

Big Picture
The week’s performance was in line with our expectations. Based on past years, performance should be softer in the week ending 1 October 2022 due to the observance of Rosh Hashanah. However, Hurricane Ian aftermath will likely result in increased demand in evacuation zones in Florida and other parts of the Southeast U.S., which could mitigate the expected decrease from the religious holiday. Longer term, we expect elevated demand in certain parts of Florida due to insurance and restoration crews working through the devastating aftermath of Hurricane Ian.
About STR
STR provides premium data benchmarking, analytics and marketplace insights for the global hospitality industry. Founded in 1985, STR maintains a presence in 15 countries with a corporate North American headquarters in Hendersonville, Tennessee, an international headquarters in London, and an Asia Pacific headquarters in Singapore. STR was acquired in October 2019 by CoStar Group, Inc. (NASDAQ: CSGP), the leading provider of commercial real estate information, analytics and online marketplaces. For more information, please visit str.com and costargroup.com.