In Focus: Nashville, TN
Nashville, capital of Tennessee, has experienced a renaissance in the last several years. Booming health care, manufacturing, and technology industries coupled with a low cost of living has led to strong population and employment growth. The ramping up of the Music City Center has bolstered room-night demand and helped push hotel occupancy to a new peak. Furthermore, the city's growing national and global profile has led to significant increases in travel and tourism; Nashville was the only U.S. city listed on Lonely Planet's Top Ten City Destinations of 2016.
The following HVS In Focus report details recent performance and market trends relevant to the Nashville hotel industry, as well as data and forecasts that can assist hotel stakeholders with buying, selling, and holding opportunities.
Hotel Market Performance
Overview of Historical Occupancy and Rate Trends
The following charts illustrate trends in forecasted occupancy, average daily rate, and RevPAR for Nashville hotels from 2016 to 2018.
Nashville's demand levels have improved steadily and significantly during the last ten years, a trend attributed in part to the relocation of Nissan North America and other corporate entities to the area; expansions at existing employers, particularly in the healthcare sector; the increasing popularity of special events such as the CMA Music Festival, Country Music Marathon, and the Music City Bowl; and the increasing national profile of Nashville as a tourism destination. Occupancy levels in the market have fluctuated somewhat given the overall increase in supply during this period of strong demand growth. After rising from 2004 th rough 2006, occupancy levels declined through 2009, as new supply entered the market and dwindling corporate profits and discretionary income levels caused demand to constrict. However, the market quickly rebounded in 2010, fueled by cleanup and recovery efforts following the Nashville flood in May of that year. Occupancy has continued to grow year-over-year since 2010 as demand fundamentals remain strong and supply growth remains limited.
Average rate increased year-over-year from 2004 through 2008 given the strong demand growth and favorable supply trends during that period, which enabled hoteliers to limit discounts and pursue aggressive pricing strategies. Average rate growth slowed in late 2008, and rates declined substantially in 2009, as hotel operators offered discounted rates and took on lower-rated business in the face of slowed demand growth and supply increases. By mid-year 2010, rebounding demand levels provided hotels with the pricing power to begin to limit discounts, resulting in less of a decline in the average-rate level for the year. Rate growth resumed in 2011, a trend that continued through 2015, as favorable supply and demand dynamics have allowed hoteliers to raise rates aggressively while reaching new occupancy peaks.
In the latter half of the last decade, supply growth picked up, averaging approximately 2.0% per year from 2007 through 2009. Temporary closures caused by the flood in 2010 led to a decline in supply before available room nights increased significantly in 2011 as flood-affected hotels reopened throughout the market. New hotel openings were limited between 2011 and mid-year 2013, as the unavailability of construction financing during the recession caused many projects that had been on the drawing board to be canceled or put on hold. As credit markets loosened during the last few years, construction financing became more readily available; concurrently, the market has registered unprecedented occupancy and average rate growth and a new convention center has opened. As a result, Nashville has become a primary market for new hotel development.
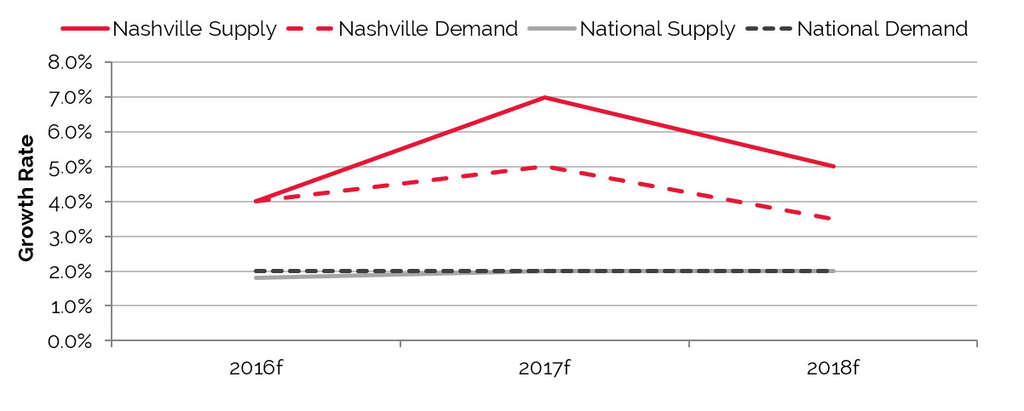
The trajectories of growth in hotel supply and demand in Nashville are expected to align in 2016, resulting in market equilibrium. This effect is anticipated to be temporary, as more than 5,000 new rooms are scheduled to arrive in 2016 and 2017. The market remains poised to absorb the majority of new supply; however, the volume of new hotels will likely push occupancy downward. There are several factors that have contributed to the city's strong occupancy growth. The profile of the leisure traveler has shifted substantially over the past several years, with many travelers arriving earlier and staying longer. Additionally, the opening of the Music City Center has brought in large conventions that fill demand in shoulder periods. These trends are expected to result in a stabilized occupancy level well above the 64% ten-year average. Moreover, significant unaccommodated demand exists in the market, particularly in the Downtown submarket. The following chart provides some perspective on the amount of new rooms the area could accommodate and still maintain its historic ten-year average occupancy.
Existing Supply Breakdown
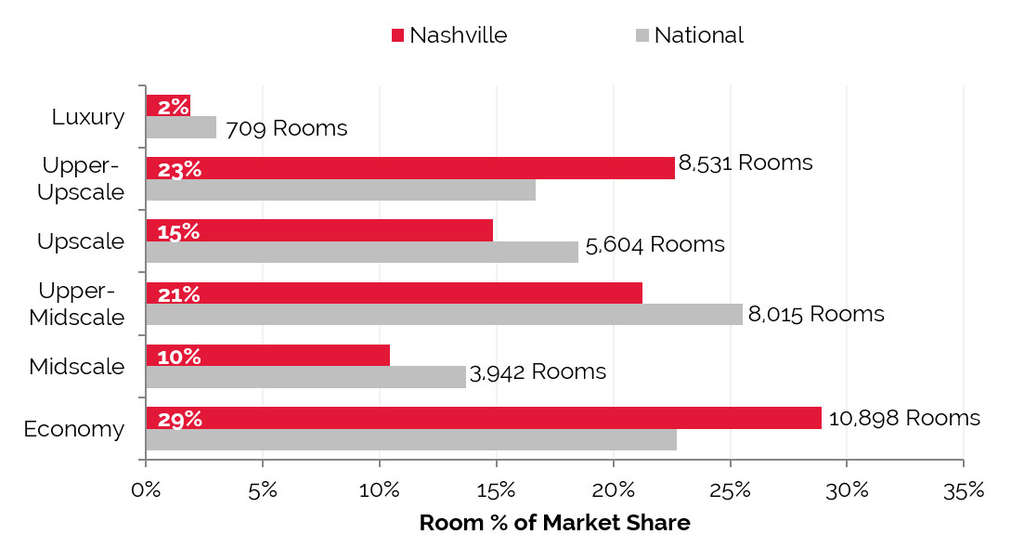
Almost 30% of Nashville-area hotels are economy properties, and economy hotels provide the most rooms at approximately 10,900 rooms. This figure exceeds the national average of 23%. Conversely, Nashville's luxury segment comprises just 2% of the total rooms inventory, which is below the national average of 3%; this is also far below markets such as Austin and New Orleans, where luxury hotels make up close to 10% of the total hotel supply in each market.
Although upper-upscale properties equate to only 5% of hotels in Nashville, the room inventory of this asset class amounts to almost 25% of the city's total room count. This is because these types of properties are typically "big box" in nature, housing large room counts, ample meeting and event space, and a number of food and beverage outlets. These hotels also tend to be located close to the city's largest demand generators, particularly in the downtown area. In Nashville, this segment exhibits the greatest variance to national averages, standing well above the nationwide average of 17%.
Pent-up demand among the market's least price-sensitive travelers bodes well for the existing supply, as well as new development within the upper-upscale and luxury classes. While rising average rates should help spur development of high-end assets, increasing land prices Downtown and rising construction costs have become significant barriers to building true luxury properties in Nashville.
The charts below present a breakdown of Nashville's room inventory by hotel class.
New Supply Pipeline
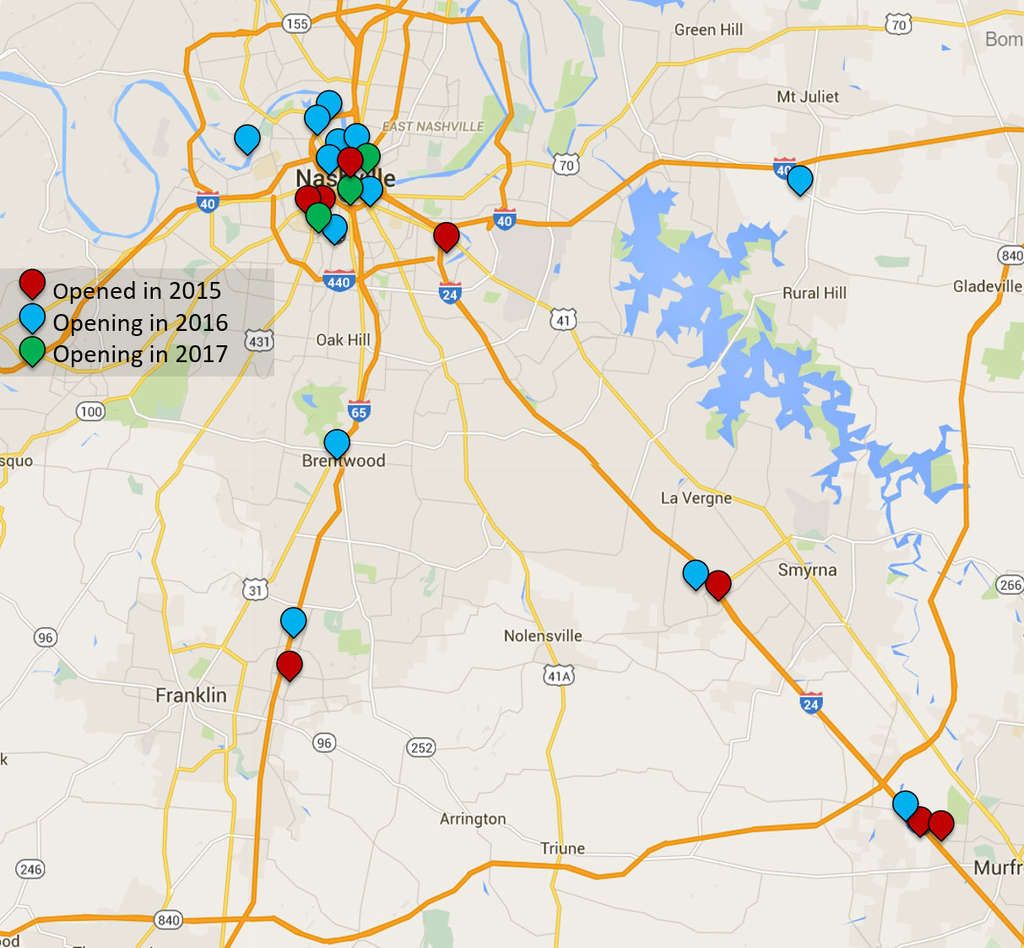
Hotels belonging to the upscale class dominated new hotel openings in 2015. Of the roughly 1,000 new rooms that opened, just over 700 belonged to this class. While upscale hotel development is expected to remain strong throughout the next several years, development trends are anticipated to shift to higher-end assets to accommodate the needs of existing and expanding commercial and leisure demand generators in Nashville. This is especially apparent in the city's SoBro district and downtown area, which tend to generate a wealth of higher-rated clientele. Developers are taking advantage of the higher rates these hotels command given the number of travelers to Nashville with the means to pay for a centrally situated, higher-class hotel rooms. Of the approximately 3,600 hotel rooms currently under construction or about to begin construction, 2,000 are classified as either upper-upscale or luxury. Of these projects, all but the Kimpton Midtown are located in the downtown area.
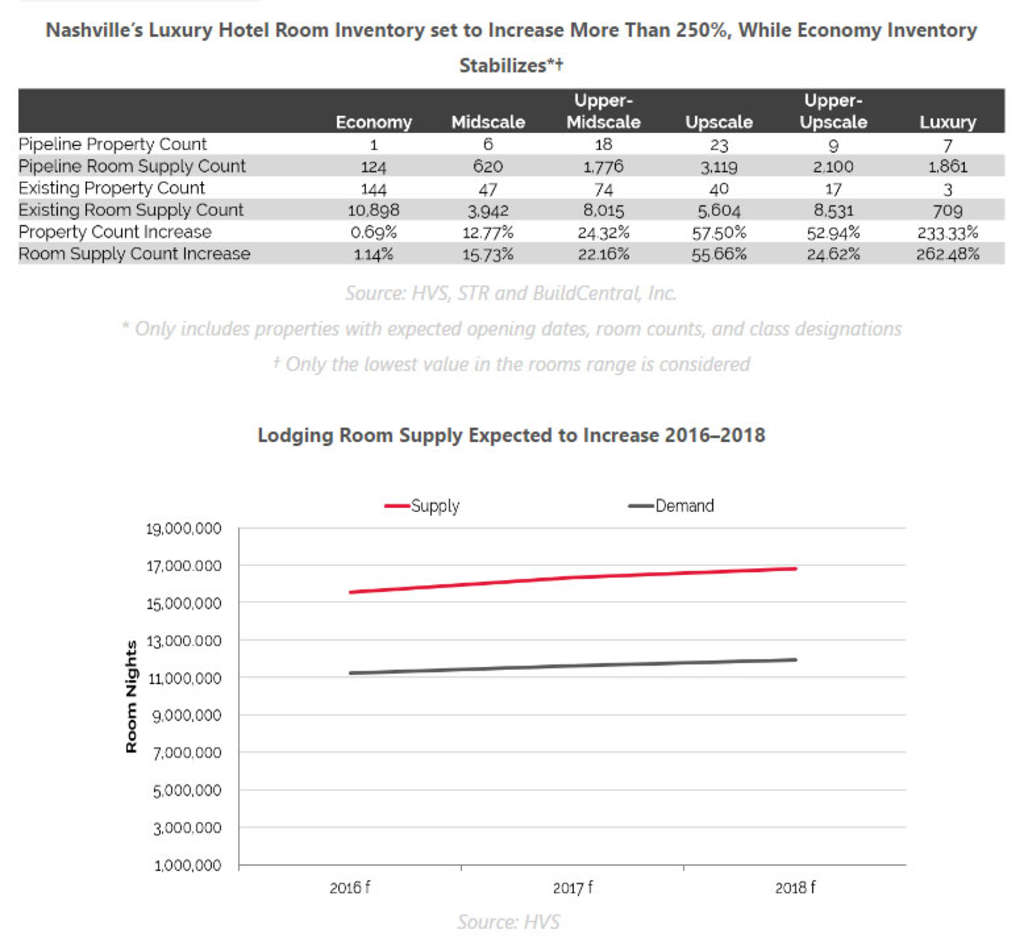
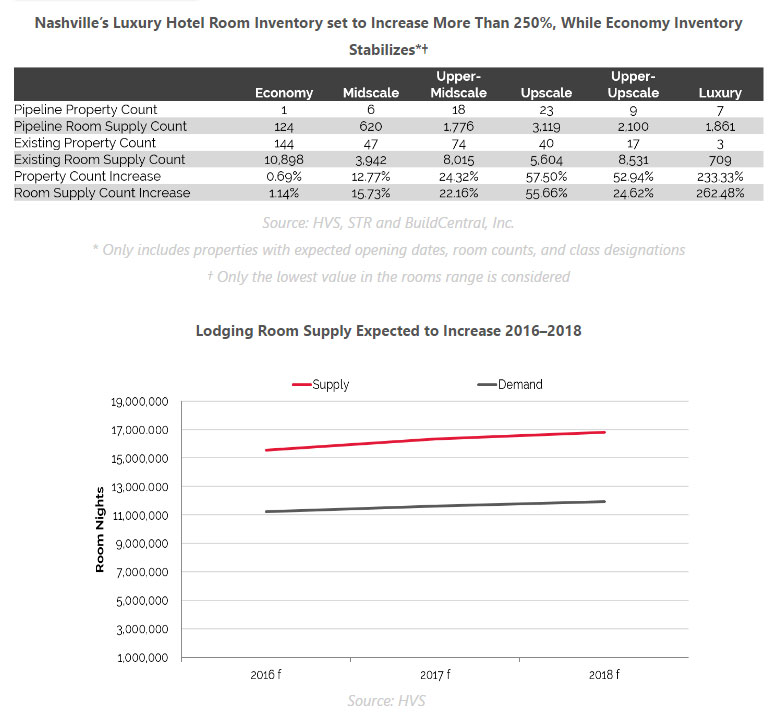
The following table reflects an increase of over 9,000 rooms, in addition to the 1,300 rooms that opened in 2015 and 2016. The table also includes 26 projects and at least 3,500 rooms that are in the planning stages with no firm opening date, room count, and/or brand affiliation. Considering only the projects that have announced construction timelines, expected programming, and/or anticipated brand affiliations, this represents an approximate supply increase of 25%. If all hotels were constructed as planned, there would be an approximate increase of 35% to Nashville's existing supply of 38,000 rooms. It is unlikely that all of these properties will be built, let alone on the timetable currently anticipated by developers; however, if only one-third of the approved and planned projects secure necessary entitlements and funding, Nashville's hotel supply would still increase by approximately 21%.
The CBD houses the largest concentration of supply in Greater Nashville, and this submarket is expected to receive the greatest supply increase by a significant margin. Approximately 50% of the supply increase is planned for this submarket, reflecting the continued popularity of the CBD across all demand segments. The construction of the Music City Center has bolstered meeting and group demand, and commercial entities continue to relocate to and expand in Downtown Nashville. Furthermore, with its array of tourist attractions, restaurants, and entertainment venues, Downtown is considered the premier submarket for the leisure segment.
Of the property classes and room counts that have been determined, the following chart illustrates the class breakdown of the new supply.
Hotel Valuation Expectation
The annual HVS Hotel Valuation Index (HVI) compiles data derived from over 4,500 hotel appraisal assignments each year, providing for analysis of performance and forecasts for hotel markets nationwide. The Nashville hotel market achieved annual RevPAR growth of roughly 13.0% from 2011 through 2015—a remarkable achievement that made Nashville the top market for growth in the nation. Market-wide occupancy reached 69% in 2013, and average rate rose just above the $100 mark for that year. Prior to 2013, occupancy in Nashville had peaked at 66% in 2006, and the city's average daily rate peaked in the mid-$90s in 2008. The city has reached new occupancy and rate highs each year since 2013.
This nation-leading RevPAR growth has spurred transaction activity; however, new hotel development has increasingly come to center stage. A myriad of new projects will introduce high-quality supply and new brands to the Nashville market, including Moxy by Marriott and the 21c Museum brand. While increasing demand and developments support a positive outlook for hotel value growth, the volume of new supply is expected to lower market-wide occupancy and limit rate growth, causing hotel values to stabilize.
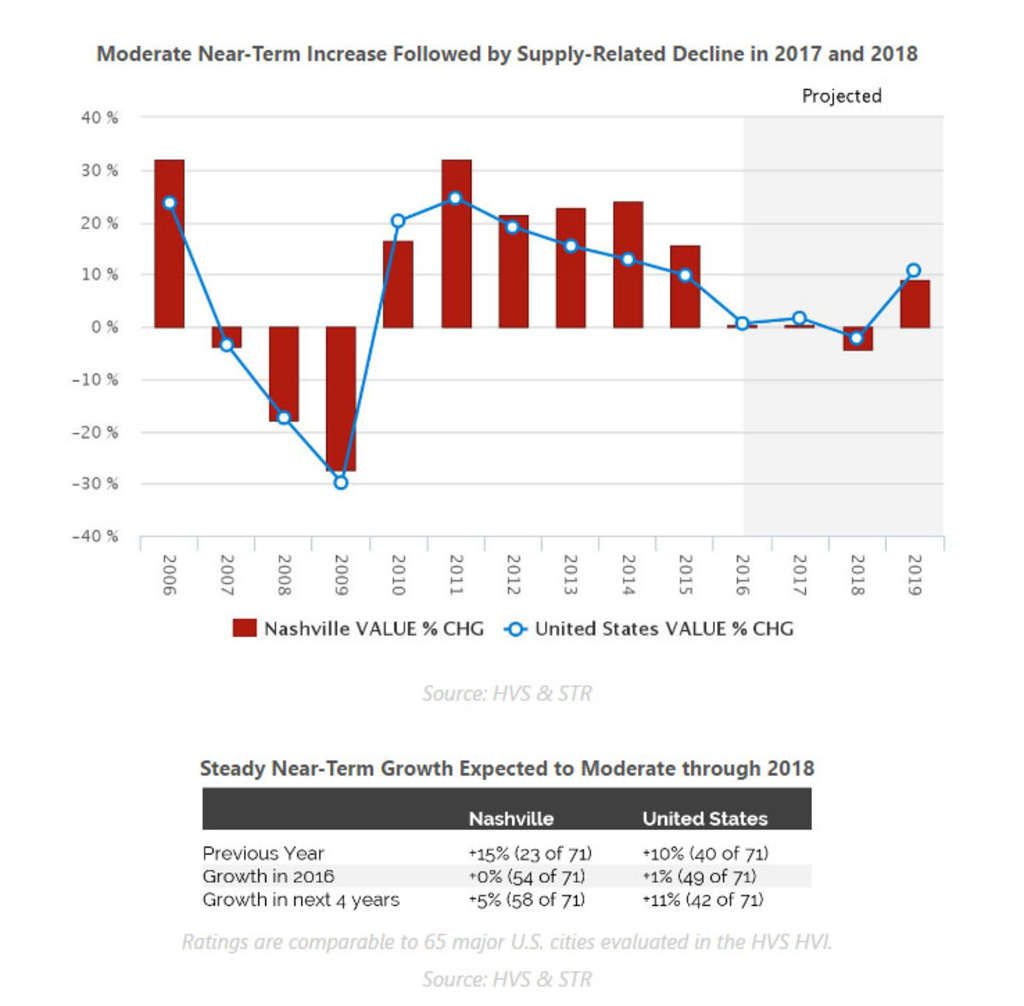
Nashville ranked 23 out of 71 major U.S. markets in hotel value growth in 2015, with a 15% increase. This increase was due in large part to the significant amount of rate growth experienced by the market in recent years. Nashville hotel values are estimated to remain stable in 2016. The Nashville market is expected to be outpaced by the nation as a whole through 2018, largely due to the impact of new supply throughout this period, with values increasing by only 5% in four years. This modest growth places Nashville in roughly the bottom one-third of markets nationally. The following chart illustrates the trajectory of hotel values in Nashville from 2006 through 2019.
Hotel Transactions
The following table details hotel transactions in the greater Nashville area since 2013.
Transaction activity has been strong in the Nashville area, with buyers competing heavily for the limited number of assets for sale, and sellers seeking to monetize their investment gains. Transaction activity has increased since 2013 and 2014, when approximately $165 million in volume changed hands each year. In 2015, hotel transactions totaled more than $200 million.
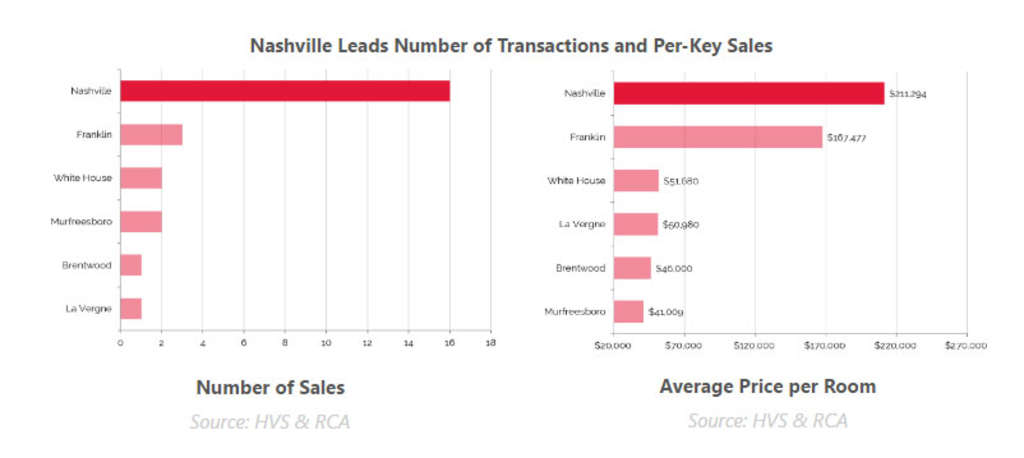
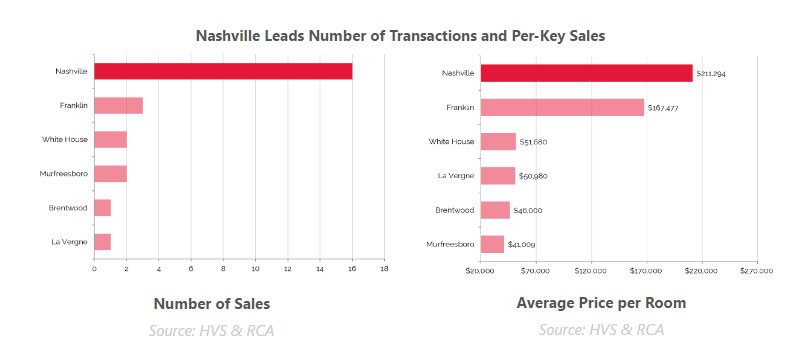
The sales above, which total just over $500 million in transaction volume, include such high-profile assets as the Union Station Hotel - Autograph Collection, whose price of $418,000 per key is the highest paid in the Nashville MSA on a per-key basis. In terms of total price, the Sheraton Music City holds the top spot, selling for $75,000,000 in June 2015.
Pricing continues to increase along with transaction volume. The average price per room of transactions in 2015 registered at approximately $165,000, compared with $135,000 in 2013 and 2014. Two full-service assets, the Embassy Suites by Hilton Vanderbilt and the Courtyard by Marriott Downtown, sold in 2015 for more than $300,000 per key. Additionally, in 2016, the Hampton by Hilton Downtown was sold for nearly $40,000 per key.
Interest among investors remains high and continues to put downward pressure on capitalization rates, particularly in high barrier-to-entry submarkets such as the CBD and West End. The high level of investor interest, Nashville's thriving economy, and growing demand generated by the tourism sector support a positive outlook for the city's hotel industry overall, with values set to rise in the near term before stabilizing through 2018.
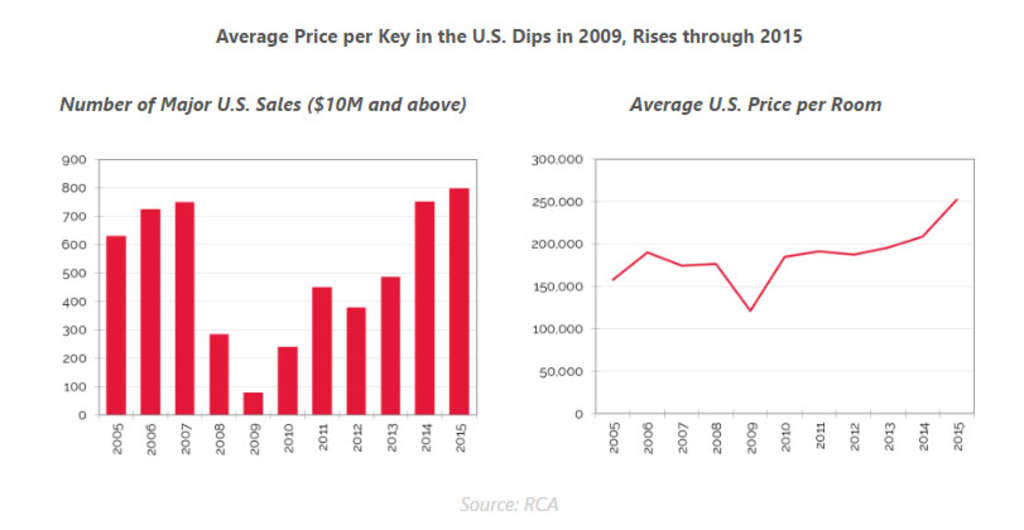
Across the nation, according to Real Capital Analytics, the lowest confirmed hotel sale for the preceding three years was the Hotel Seagate in the Toledo, Ohio CBD at $2,830 per key. The next two lowest sales occurred in Chicago and Atlanta. The highest confirmed sale, at $1.85 million per key, was the purchase of the Park Hyatt Hotel in the Manhattan Midtown West neighborhood. The next runner up was the Hollywood St. Louis in Missouri at $1.22 million.
Key Economic Indicators
Economic and Demographic Review
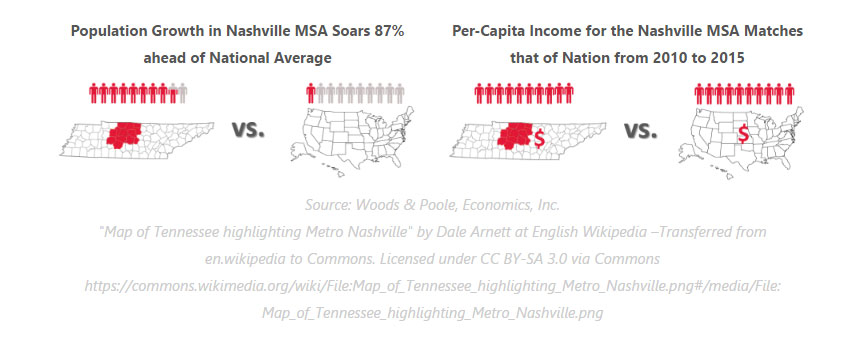
The U.S. population grew at an average annual compounded rate of 0.9% from 2010 to 2015, and that rate is forecast to increase slightly to 1.0% into 2020. From 2010 to 2015, Davidson County's population growth exceeded the nation's growth rate, at 1.1%, and the Nashville MSA grew substantially, exceeding both the nation and county with a compounded average annual growth rate of 1.8% from 2010 to 2015. These growth rates are expected to be sustained through 2020. Population growth is being spurred in part by strong job growth in the Nashville metro area, which will be discussed in more detail later in this report.
At 1.2% each, the average annual compounded growth rates of per-capita personal income for the county and MSA between 2010 and 2015 aligned with the national average of 1.2%. Anticipated growth into 2020 for the county is 1.6%, versus 1.3% for the nation. Anticipated growth into 2020 for the Nashville MSA lags slightly behind the county but exceeds the nation at 1.4%
The national wealth index for the MSA trended flat from 2000 to 2015; it is anticipated to remain flat into 2020. Conversely, Davidson County's wealth index declined slightly from 2010 to 2015; it is expected to grow by 0.2% per year through 2020.
Food and beverage sales in the county grew at an annual compounded rate of 2.2%, with $1.50 billion in 2010 and $1.67 billion in 2015. Through 2020, the pace of growth is anticipated to moderate to 1.7% for the county. The Nashville MSA reflected more robust sales, with $2.792 billion in 2010 and $3.217 billion in 2015. This reflects an average annual compounded growth rate of 2.9% from 2010 to 2015, which exceeds the national growth rate of 2.2%. While the food and beverage sales in the county are expected to grow at a slower pace than national sales, the Nashville MSA is forecast to outpace the nation through 2020.
The retail sales sector grew slightly in the Nashville MSA, the state, and the nation from 2000 through 2010; however, the Davidson County retail sales sector remained flat through this period. Retail sales in the county grew in line with the nation from 2010 to 2015, exceeding $13 billion in 2015. The retail sales sector has increased continuously across the MSA, state, and nation since 2010; this trend is expected to continue through 2020.
Radial Demographic Indicators
The following table reflects radial demographic trends for the Nashville market area as measured by three points of distance from the center of Downtown Nashville.
Population growth within one mile of the center of Downtown was 7.3% from 2000 through 2010, whereas the greater area experienced a less pronounced yet still healthy growth rate of 4.6% during that same period. Conversely, the closer-in area within five miles of Downtown experienced a decline in population during that time. The population growth rate is 9.1% for the area within one mile of the city center from 2010 to 2016, and projected growth is anticipated to continue at about 9.7% per year into 2021. Population growth for the areas ten miles outside of Downtown increased from 2010 to 2016, as these urban neighborhoods have become increasingly popular with the city's younger demographic. These growth rates are expected to moderate somewhat by 2021.
Nashville's estimated 2016 average and median household incomes, positively skewed in line with general income distribution trends, are strong in comparison to other Tennessee cities, as well as the nation.
Workforce Characteristics
The characteristics of an area's workforce provide an indication of the type and amount of transient visitation likely to be generated by local businesses. Sectors such as finance, insurance, and real estate [FIRE]; wholesale trade; and services produce a considerable number of visitors who are not particularly rate-sensitive. The government sector often generates transient room nights, but per-diem reimbursement allowances often limit the accommodations selection to budget and mid-priced lodging facilities. Contributions from manufacturing, construction, transportation, communications, and public utilities [TCPU] employers can also be important, depending on the company type.
From 2000 to 2010, total employment in the MSA grew at an average annual rate of 0.8%, in line with the national average. The pace of employment growth in the MSA increased considerably to 1.9% on an annual average from 2010 to 2015. Woods & Poole Economics, Inc. anticipates total employment in the county to change by 1.9% on average annually through 2020. The MSA trend is 41% more robust than the forecasted rate of change of 1.3% for the U.S. as a whole.
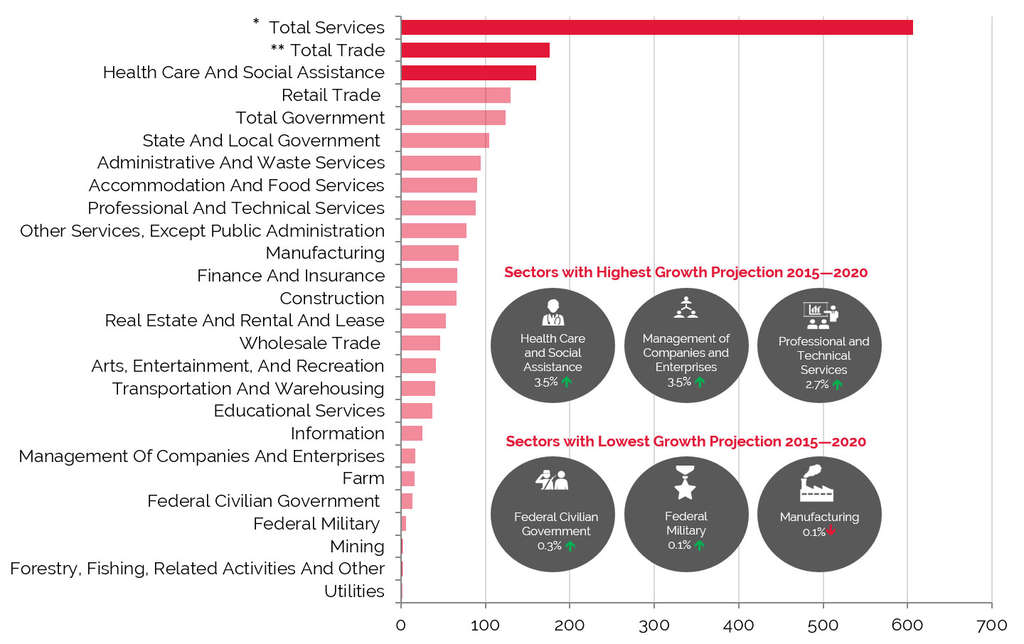
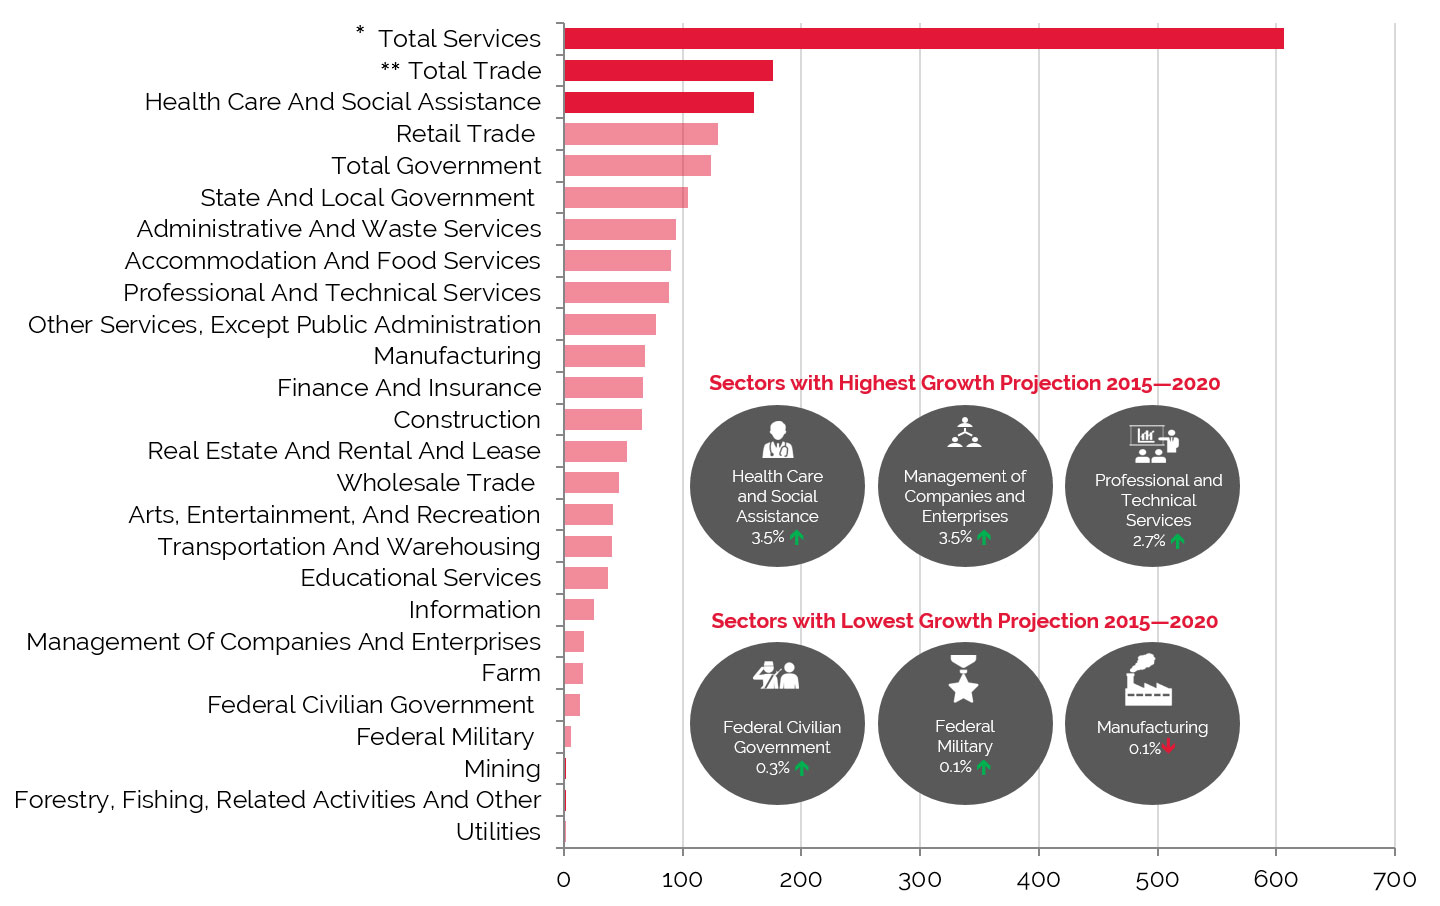
The finance, insurance, and real estate [FIRE]; wholesale trade; and services employment sectors represented 60.4% of total employment in the Nashville MSA in 2015, with an average annual compounded growth rate expected to be greater than 2.0% into 2020; as stated above, these sectors are important drivers of demand to higher-rated hotels. Total Government, the third-largest primary employment sector in 2015, tends to generate demand for midscale and upper-midscale properties, as per-diem rates limit travelers to lower-priced hotels.
The largest primary sector was Total Services, which recorded the highest rise (69,735) in number of employees during the period from 2010 to 2015. Of the various sub-sectors included in Total Services, Health Care and Social Assistance and Accommodation and Food Services were the largest employers, followed closely by Professional and Technical Services.
Employment
Nashville's collection of businesses, government agencies, entertainment venues, historical attractions, and Vanderbilt University serve as a platform for the city's diverse workforce. Government jobs and investments related to state, city, county, and federal entities provide a solid economic base for the area. In addition, Vanderbilt University and several other institutions of higher education have continually supplied the local labor pool with young, well-educated, and relatively inexpensive workers. In 2016, Nashville ranked 4th on Forbes's annual list of America's top cities for job growth.
The following table illustrates historical and projected employment, population, and income data for the overall Nashville market as presented by REIS.
Top Industries In Nashville
The economic base is diverse in this market, with strong employers in the healthcare, music, publishing, manufacturing, and tourism sectors. Nashville's musical heritage continues to support the city's status as a cultural center, and the profile of the city and its music industry has been raised by the 2012 debut of Nashville, a primetime television drama filmed in the city and focused on its music scene.
All major record labels, as well as numerous independent labels, have offices in Nashville (primarily in the "Music Row" area). Since the 1960s, Nashville has been the second-biggest music production center in the U.S., after New York. In addition to music production, Nashville's status as Music City USA influences other sectors of the economy, such as manufacturing and tourism. Nashville is home to Gibson Guitars, one of the world's most respected and recognized manufacturers of guitars, pianos, drums, and other instruments. Nashville is also home to the Country Music Association, host of the CMA Music Fest annually in early June. This event attracted a record-setting crowd of 88,500 in 2016. Bonnaroo, an annual music festival held 60 miles southeast of Nashville in Manchester, typically draws a similar number of visitors. In 2014, the Country Music Hall of Fame and Museum expanded its facilities from 140,000 square feet to over 350,000 square feet, representing a $75-million investment.
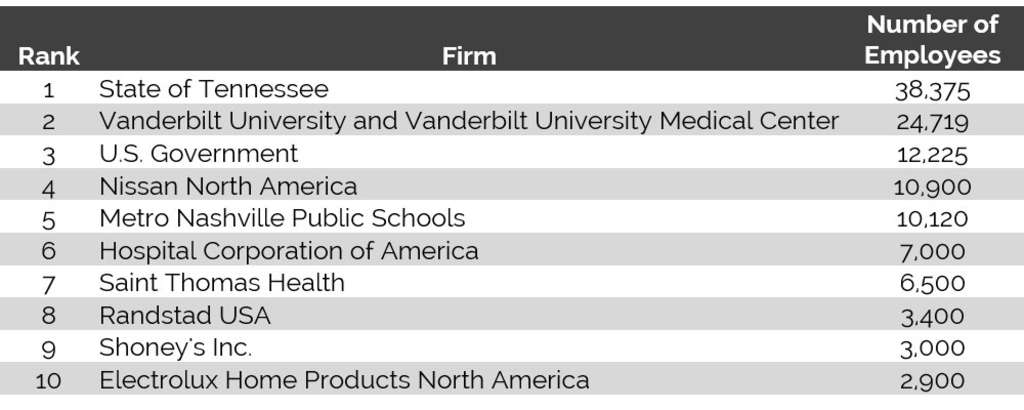
Although Nashville is renowned as a music-recording center and tourist destination, healthcare represents an important economic sector. The greater Nashville area is home to more than 250 healthcare companies, including seven of the twelve largest private hospital operators in the United States, anchored by Hospital Corporation of America (HCA) and Community Health Systems (CHS). HCA is building a 16-story tower that will feature over 500,000 square feet of office space for the headquarters of two of its subsidiaries, Sarah Cannon Research Center and Parallon Business Solutions. Both entities are expected to expand in the new location, creating an estimated 2,000 new jobs by 2017. The $200-million project, scheduled to open by the end of 2016, is one of the first developments of a larger 32-acre mixed-use project in the North Gulch.
Vanderbilt University is a private research university with a total enrollment of approximately 13,000 undergraduate and graduate students. Founded in 1873, the university now comprises four undergraduate schools and six graduate and professional schools. Several research centers and institutes are affiliated with the university, including the Vanderbilt Institute for Public Policy Studies, Freedom Forum First Amendment Center, Dyer Observatory, and Vanderbilt University Medical Center (VUMC). The University is consistently ranked among the top 20 universities in the U.S., and the law school and medical school also routinely rank among the top 20 graduate schools in their respective fields. With over 20,000 employees, Vanderbilt University is the largest private employer in central Tennessee and one of the largest private employers in the state. With the exception of the off-campus observatory and satellite medical clinics, all of its facilities are situated on the 330-acre campus in the West End area of Nashville. The Vanderbilt University Medical Center is a vital component of the university and is the only Level I Trauma Center in Middle Tennessee.
The automotive industry has become increasingly important for the region. Nissan North America completed a four-year relocation process in 2010 when the company opened its corporate headquarters in Franklin. Nissan also operates its largest North American manufacturing plant in Smyrna. Additionally, Nashville is home to Bridgestone America's Tire Operations, the North American business unit of Japan-based Bridgestone Corporation. Bridgestone Corporation, the world's largest tire/rubber company, will consolidate its Nashville presence to the downtown area in a new 514,000-square-foot office building that is expected to open in 2017. In 2012, General Motors invested approximately $759 million in its plant to begin engine production and Chevrolet Equinox assembly. Additionally, General Motors will begin production of its 2017 Cadillac XT5 (SRX) crossover at its plant in Spring Hill in 2016; the company is investing $185 million to begin construction of small gas-powered engines at the plant. Nissan opened a $1-billion plant in late 2012 to manufacture lithium-ion batteries for its Leaf electric car. The company has announced plans to construct a $160-million logistics center to support growing demand; the facility is scheduled for completion in 2017.
Unemployment
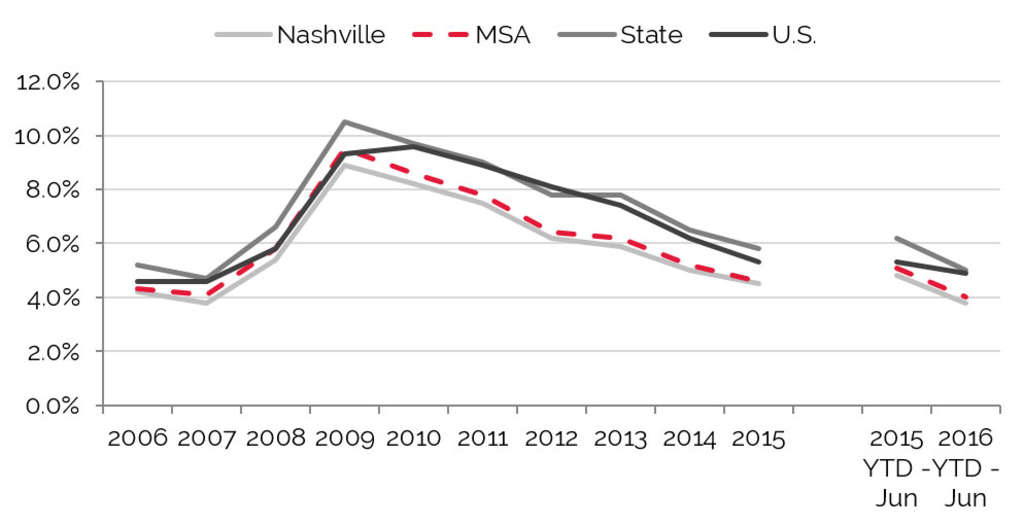
After showing year-over-year improvement, unemployment began to rise in 2008, and this trend accelerated in 2009. Unemployment began to decline in 2010 and improved significantly in 2012 as the economy rebounded, a trend that continued through 2015. The most recent comparative period illustrates improvement, indicated by the lower unemployment rate in the latest available data for 2016. Expanding employment in the healthcare, retail, and technology industries, as well as the recovery of the automotive manufacturing industry, has positively affected the employment market, driving local unemployment rates well below the state and national levels.
Office Space
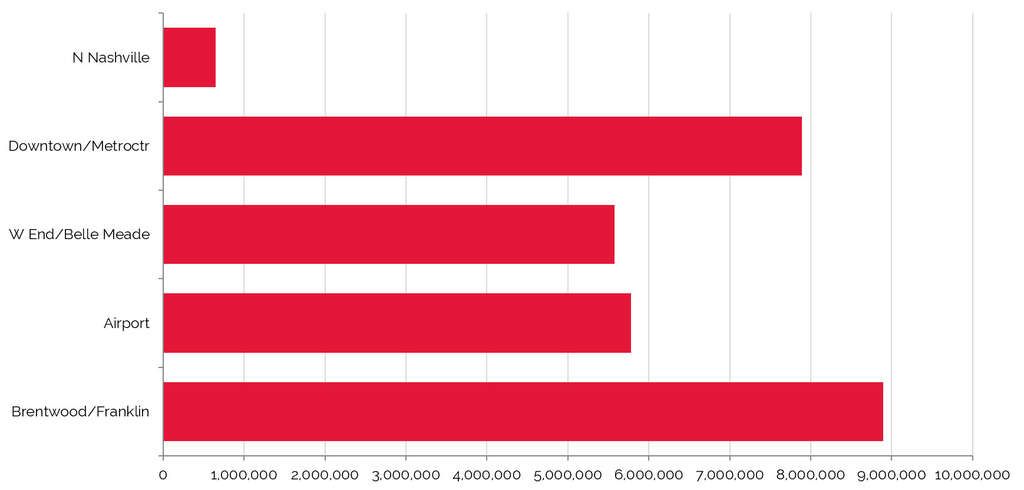
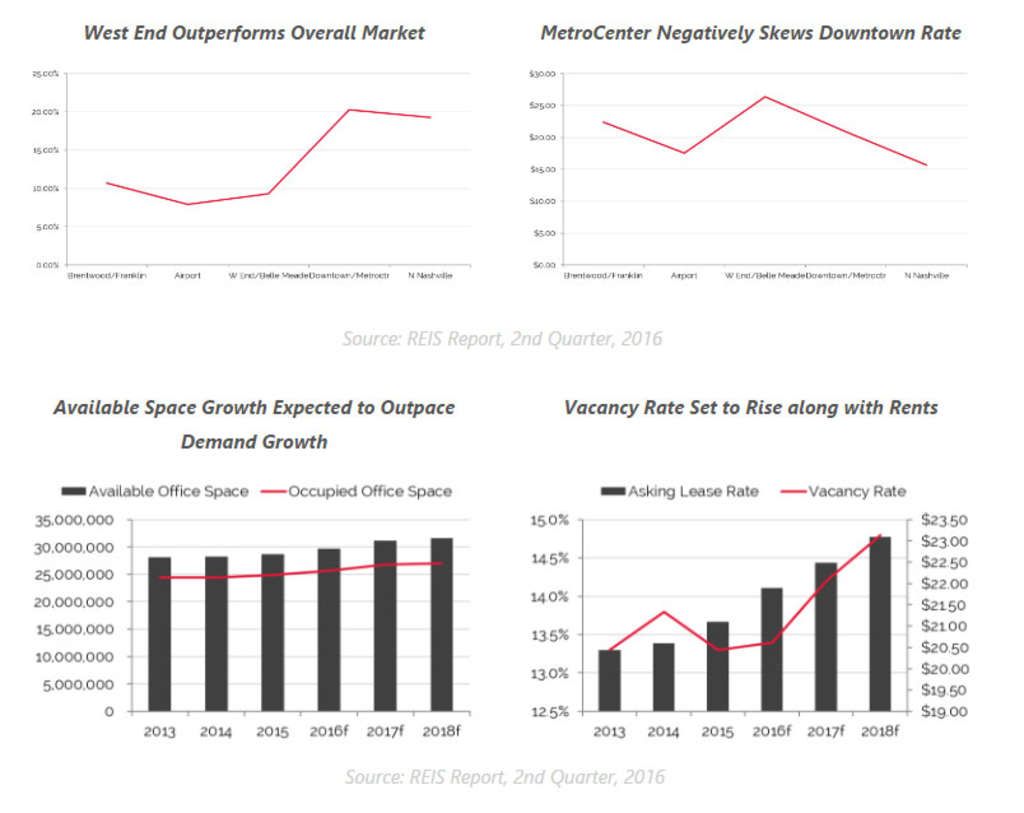
Trends in occupied office space are typically among the most reliable indicators of lodging demand, as firms that occupy office space often exhibit a strong propensity to attract commercial visitors. Thus, trends that cause changes in vacancy rates or in the amount of occupied office space may have a proportional impact on commercial lodging demand and a less direct effect on meeting demand. Greater Nashville's 29 million square feet of office space had an overall vacancy rate of 13.3% and an average asking rent of $21.11 in 2015.
Nashville's dearth of Class A office space and booming economy has led to a flurry of new development projects, with at least seven projects totaling more than 1.5 million square feet currently under construction in the MSA, including HCA's 580,000-square-foot Parallon office building in The North Gulch. Development has generally been focused on the area's top three submarkets, West End, Downtown, and Franklin/Brentwood.
The Downtown submarket, anchored by government entities and major corporations, is the focal point for new office development, particularly in the popular Gulch and SoBro neighborhoods. The most recent delivery in Nashville was the 300,000-square-foot Gulch Crossing office development, which opened mid-year 2015 at the corner of 11th Avenue and Demonbreun Street Downtown in The Gulch. Eakin Partners' 15-story, 285,000-square-foot office development, also in The Gulch, is expected to open in the fourth quarter of 2016. Other major projects planned for the CBD include the 506,000-square-foot Bridgestone Americas headquarters building, to be located at 4th Avenue South and Demonbreun, and Hines and C.B. Ragland Company's 350,000-square-foot office building at 222 2nd Avenue South. Both buildings are slated to open in 2017. These high-end office developments are helping to push rents closer to the $40-per-square-foot mark.
The West End submarket boasts high concentrations of healthcare and education-related employment and features low vacancy and high leasing rates. In 2015, Panattoni Development Company broke ground on a 95,000-square-foot office building in the Music Row neighborhood, representing a $31-million investment. Also in 2015, Eakin Partners announced plans for a 12-story, 200,000-square-foot office building one block off of West End Avenue.
The Franklin/Brentwood submarket, the largest in terms of both available and occupied space, has also had increased development. Activity is led by two Highwood Properties buildings, which total over 300,000 square feet in the Seven Springs development in Brentwood. Highwood Properties is also planning to develop 1.4 million square feet of Class A office space as part of the Ovation development in the Cool Springs submarket of Franklin. Also in Cool Springs, Crescent Communities is planning a 155,000-square-foot office building, and local developer Pat Emery is planning a ten-story office building to follow up his similarly sized One Franklin Park, which opened in 2015.
Nashville has become a prime choice for corporate relocation in the automotive, healthcare, logistics, and technology industries. These tenants continue to add jobs and absorb new office space. This activity should, in turn, lead to greater demand for lodging throughout the area. We note that these office statistics do not include owner-occupied buildings; the CBD is replete with city, county, state, and federal offices. Available and occupied space grew at an average annual compound rate of 1.0% from 2002 through 2015, and high demand levels absorbed the majority of new supply through 2015. However, supply is forecast to outpace demand from 2016 to 2019, with the inventory of occupied office space expected to increase at an average annual compound rate of 1.6%, and available office space anticipated to increase 2.4%. The resulting expected vacancy rate of 15.9% in 2019 is the highest level since the early 2000s.
Convention Activity
A convention center serves as a gauge of visitation trends to a particular market. Convention centers also generate significant levels of demand for area hotels and serve as a focal point for community activity. Typically, hotels closest to a convention center (up to three miles away) will benefit the most. Hotels serving as headquarters for an event benefit the most by way of premium rates and hosting related banquet events. During the largest of conventions, peripheral hotels may benefit from compression within the city as a whole.
In May 2013, the City unveiled the new, $635-million Music City Center (MCC) in the heart of Downtown Nashville. The 1,200,000-square-foot complex includes a 350,000-square-foot exhibit hall, a 67,500-square-foot ballroom, and an 18,000-square-foot junior ballroom, as well as 90,000 square feet of additional meeting space in 60 breakout rooms. In addition, the $250-million, 800-room headquarters Omni Nashville Hotel opened adjacent to the new convention center in October 2013. However, Nashville remains somewhat disadvantaged by its lack of guestroom inventory to support the booking of large-scale meetings at the new state-of-the-art convention center. As such, several new hotels have been proposed for the downtown area. In January 2015, construction began on a 454-room Westin hotel adjacent to the convention center. Prior to the opening of the Music City Center, the Nashville Convention Center served as Middle Tennessee's primary convention center. The Nashville Convention Center, which opened in 1985, contains 118,675 square feet of exhibit space, a 10,920-square-foot ballroom, and 20,000 square feet of meeting rooms. The center is located adjacent to the Renaissance Hotel, which contains an additional 31,000 square feet of meeting space. The City of Nashville has approved plans to redevelop the Nashville Convention Center into a large mixed-use development comprising 205,000 square feet of retail, restaurant, and entertainment uses; 300,000 square feet of Class A office space; 350 luxury apartment units; and space for the creation of the National Museum for African-American Music. The Nashville Convention Center remains operational in the interim, managed by the Renaissance Hotel. The $400-million project is expected to begin demolition work in 2016, with an estimated completion set for 2018.
According to CVB officials, the average event size at the Music City Center is significantly larger than the events held at the old facility because of the more expansive event space. Reports from the market reflect that the facility is highly utilized by groups such as national and international professional associations and trade shows. While the number of events decreased in 2014/15, large events such as the National Rifle Association (NRA) Annual Meeting brought an overall increase in attendance. Furthermore, the types of conventions held at the MCC, which tend to have a greater national profile than those of the former convention center, have spurred additional room-night demand, as attendees to these events typically travel from farther away, and stay longer than attendees of trade shows, consumer shows, or local events. Reports from city officials suggest a continuation of this trend, as definite room nights are ahead of pace but event bookings are lower for 2016. Current bookings are reportedly just under pace from 2017 through 2019 for both events and room nights.
The limited guestroom inventory proximate to the convention center remains a hindrance in booking the facility to its full potential; however, the scheduled addition of two big-box convention center hotels, the Westin and the JW Marriott, is anticipated heighten interest for conventions in Nashville, resulting in increased room nights generated through convention business. The opening of these properties should induce demand, as the improved hotel package should enable the Convention & Visitors Bureau (CVB) to target more citywide conventions that require more on-peak room nights than the market can currently accommodate. Moreover, these hotels are expected to offer substantial amounts of in-house meeting space. As such, they should draw new groups, events, and large conventions to this market, as these groups with planned meetings would have likely chosen an alternate destination if it were not for the availability of the new facilities.
Securing room blocks at competitive prices remains an issue for the center, as well. High levels of transient travelers paying peak rates and utilizing onsite food and beverage outlets has led to revenue managers being less willing to accept lower-rated meeting and group demand related to the center, an issue that more competitive hotel supply should help resolve.
Airport Traffic
Airport passenger counts are important indicators of lodging demand. Depending on the type of service provided by a particular airfield, a sizable percentage of arriving passengers may require hotel accommodations. Trends showing changes in passenger counts also reflect local business activity and the overall economic health of the area.
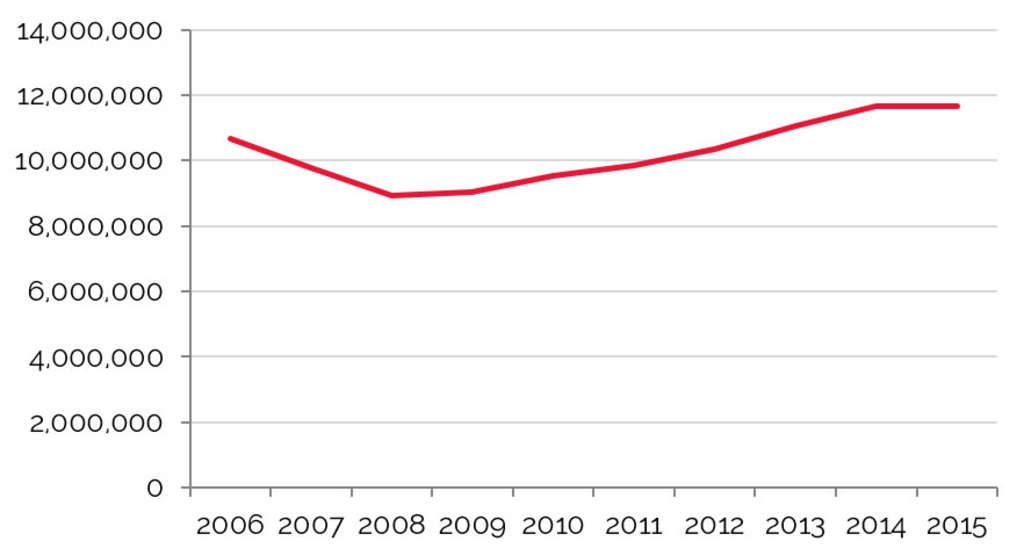
Nashville International Airport (BNA), operated by the Metropolitan Nashville Airport Authority, is situated approximately seven miles southeast of Downtown Nashville. The airport serves the Middle Tennessee, Southern Kentucky, and Northern Alabama regions and acts as a base for the Tennessee Air National Guard. Nashville International Airport accommodated over 11 million passengers in 2014, breaking its annual passenger record. This achievement was fueled by an economic revival that has made the city a prime destination for business and leisure travelers. In 2012, a five-year, multi-phase terminal renovation was completed. Upgrades included new restaurants and gift shops; a consolidated, twelve-lane passenger security checkpoint; improved flight information displays for arrivals and departures; new skylights; and new floor and wall finishes. Additionally, the airport's restrooms were renovated and expanded, the lobby and baggage claim area was expanded, and heating and air-conditioning units throughout the airport facility were replaced. Furthermore, the 1.2-million-square-foot consolidated rental-car facility in the Long-Term A parking lot opened in late 2011. The final upgrades, completed mid-year 2012, included replacing the terminal skylight glass, terminal escalators, and front terminal entrance doors.
The airport's growth in passenger traffic well outpaces the national average, and major air carriers have responded to the booking demand with additional service through Nashville. Southwest Airlines added several new nonstop flights in 2015, and Alaska Airlines began service to/from Nashville in September 2015. Moreover, JetBlue returned to Nashville in the spring of 2016, after previously having served the Nashville market from 2006 to 2008.
In the past decade, passenger traffic through BNA has grown from 9.7 million to 11.7 million travelers each year, growing at an annual average compounded rate of 2.1%. However, since 2010, passenger traffic through the airport has increased more than 5.0% average per year. Growing passenger traffic indicates higher levels of visitation; these figures speak indirectly to the strength of Nashville's commercial, convention, government, and leisure sectors.
Tourist Attractions
A wide variety of attractions and special events, as well as Music City's growing global profile as a travel destination, generates strong tourism levels throughout the year. Nashville's chief attractions range from historic music venues to state-of-the-art sports facilities.
Many popular tourist sites involve country music, including the Country Music Hall of Fame, Ryman Auditorium, and the Grand Ole Opry House. As the Grand Ole Opry took place at the historic Ryman Auditorium in the early 1940s, the nearby "Honky Tonk" bars of Lower Broadway became a creative breeding ground for performers, musicians, and songwriters hoping to make it in Music City. Nashville's "Honky Tonks" remain a popular regional draw today. The most recent addition to Nashville's music-venue inventory is the Ascend Amphitheater, which opened on the banks of the Cumberland River in Downtown Nashville in July 2015.
The Bridgestone Arena, formerly known as the Sommet Center, is an all-purpose venue that was completed in 1996. The facility hosted the United States Figure Skating Association national championships in 1997 and the U.S. Gymnastics championships in 2004. The arena, which also serves as the home of the National Hockey League's Nashville Predators, was nominated for the Pollstar Concert Industry Arena of the Year Award in 2014 for the eighth consecutive year. Bridgestone Arena will host an SEC basketball tournament each March through 2026. The SEC Men's Basketball Tournament, first held in 2015, will return in 2017, 2019–2021, and 2023–2025. The SEC Women's Basketball Tournament will be held the three remaining years.
Nissan Stadium (formerly LP Field), is home to the Tennessee Titans and is also a concert venue during CMA Fest. In April 2015, First Tennessee Park opened near Downtown Nashville; the stadium is home to Nashville's Triple-A baseball team, the Nashville Sounds.
Vanderbilt University draws thousands of tourists annually to athletic competitions, performing arts events, graduation ceremonies, and special functions. Nashville is home to a variety of museums, including the Frist Center for the Visual Arts, the Adventure Science Center, Tennessee State Museum, Belle Meade Plantation, and the Hermitage, the home of former President Andrew Jackson. In addition, the Johnny Cash Museum and George Jones Museum opened in Downtown Nashville in 2013 and 2015, respectively, paying tribute to these musicians' illustrious careers.
The CMA Music Festival, held in Downtown Nashville annually in early June, attracts nearly 90,000 country music fans to Nashville from all over the world. Additionally, Bonnaroo, a widely popular music and arts festival held 60 miles southeast of Nashville each June, attracts a similar number of fans of independent music, jam bands, and folk rock.
Nashville Shores, a 385-acre family recreation destination, is located on J. Percy Priest Lake in Hermitage, Tennessee. The facility comprises a water park, the Treetop Adventure Park, a 310-slip marina with a rental area for boats and jet skis, and 20 lakeside cabins. Nashville Shores also offers complimentary lake cruises aboard the Nashville Shoreliner, as well as miniature golf, volleyball, and numerous other recreational activities. The region's largest water park continues to expand annually, most recently adding a 57-foot-tall, 530-foot-long, four-passenger-raft water slide named the Big Kahuna in 2015.
Closing Remarks
More than ever, growth is evident in Nashville. Corporations across a myriad of industries continue to relocate and expand to the area, bolstering the stable education, health care, and government sectors. New residents arrive by the hundreds each week. Nashville International Airport has realized growing passenger counts year-after-year. Construction in Downtown, particularly in the SoBro and Gulch neighborhoods, includes office buildings, residential towers, and hotels. In addition, Nashville is experiencing expanding tourism demand driven by increased global recognition as a travel destination; additional events including the SEC Basketball Tournaments; growing popularity of the CMA Music Festival and Bonnaroo; and the addition of facilities geared toward music tourism, such as the Ascend Amphitheater.
A substantial number of new hotel rooms are planned for Nashville over the next several years, though the improving room package surrounding the convention center, increasing tourism levels, and expanding and relocating corporate entities should help generate demand to absorb the new supply. The major influx will arrive in 2017, followed by a lesser yet still significant increase in 2018, with demand keeping pace with the arrival of new supply the following year. Nashville's growth has attracted developers who are confident that growing demand levels will absorb the new supply. The city's economic anchors continue to support residents, visitors, businesses, and hotels. As we move forward through this supply growth cycle, it will be essential for hoteliers, investors, and developers to make informed decisions, including choosing the right project and submarket, relative to their hotel ambitions in order to reap the most benefits from demand generated by Nashville's growth. The addition of more upper-upscale and luxury hotels should boost hotel values through 2018; however, growth will likely be moderate as Nashville enters a more sustainable period of value growth, tempered by expected increases to supply.


