An Analysis Of Franchise Fees
In the current market environment of modest growth in revenue, hotel owners and operators are paying extra attention to their operating expenses. Per the June 2017 edition of Hotel Horizons®, RevPAR growth in the U.S. is forecast to remain under 3.0 percent from 2018 through 2021. Therefore, it will be management's ability to control expenses that will enable profits to grow.
One expense that management has less control over are franchise fees. Most of the fees charged by the franchising companies (brands) are assessed as a percent of a source of revenue. Therefore, owners and operators have mixed emotions when franchise-related costs rise. After all, if you are paying more franchise fees, then it is likely that your property's revenue is also on the rise.
To assist hotel management and ownership in their assessment of the franchise-related costs they are paying, we have analyzed data from 1,587 U.S. hotels that reported franchise fee payments each year from 2010 through 2016. The data comes from our firm's annual Trends® in the Hotel Industry survey of operating statements from thousands of hotels across the nation. Some of these properties are owned and/or operated by a brand. Others license the brand, but are operated independently, or by a third-party management company.
In our Trends® database we capture four different franchise-related fees on a discrete basis. They are:
- Royalty Payments
- Marketing Assessments
- Reservation Fees
- Guest Loyalty Program Fees
For this analysis, the sum of these four components comprise "total franchise fees". These are the data that we analyze in this article.
The Cost of Franchising
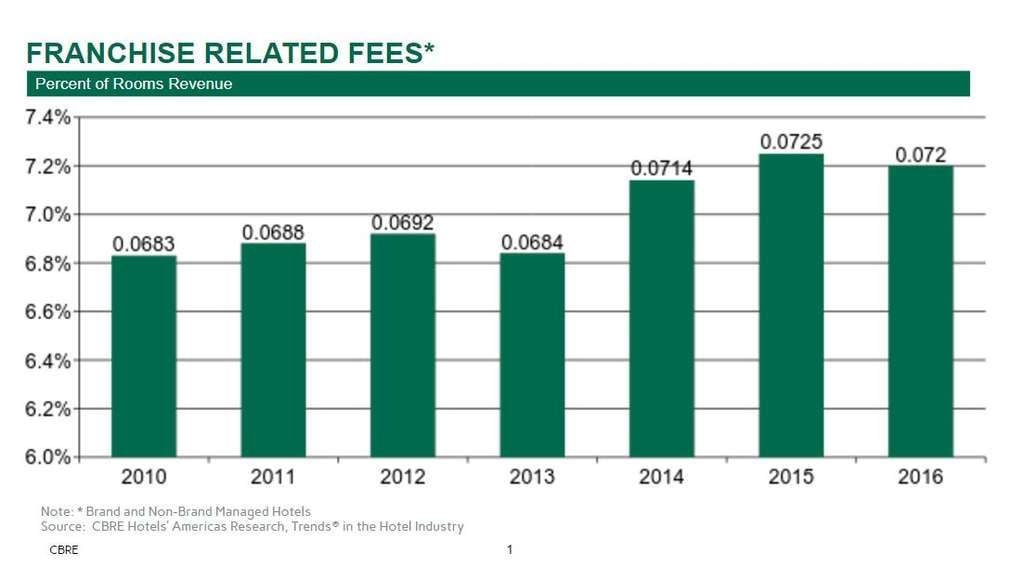
As noted before, franchise-related fees are typically assessed as a percent of revenue; most frequently rooms revenue. Therefore, it is not surprising that total franchise fees measured as a percent of rooms revenue has remained fairly constant from 2010 through 2016. In 2010, franchise fees averaged 6.8 percent of rooms revenue, or $2,326 dollars per available room (PAR). This metric increased to 7.2 percent in 2016, or $3,381 PAR.
Due to the ascending average daily room rates, franchise fee payments on a dollar per available room basis increase as you go up in chain-scale. In 2016, properties in the midscale segment averaged total franchise fees of $1,897 PAR, while luxury hotels paid $3,970 PAR. Conversely, franchise fees measured as a percent of revenue ranged from a high of 9.6 percent for upper-midscale hotels to a low of 5.2 percent at luxury properties.
The Components
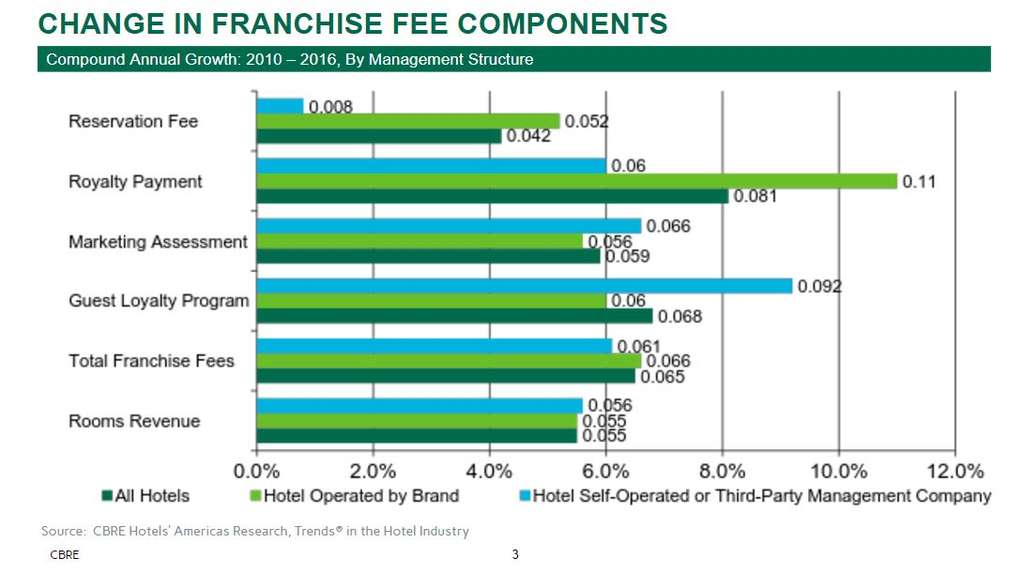
The increase in franchise fees as a percent of revenue indicates that they have grown at a greater pace than rooms revenue. From 2010 to 2016, total franchise fees increased at a compound annual growth rate (CAGR) of 6.5 percent. Concurrently, rooms revenue for the hotels in the sample experienced a CAGR of just 5.5 percent. By analyzing the four individual components of franchise-related expenses, we can identify those elements that have led the rise in fees, and those that have lagged.
In 2016, royalty payments constituted the greatest portion (29.5%) of franchise fees, followed by guest loyalty program fees (27.9%), marketing assessments (25.6%), and reservation fees (17.0%). This differs somewhat from the profile of payments made in 2010 when the largest share went towards guest loyalty program fees (27.3%), and royalty payments were only 26.8%.
The increase in franchise fees has clearly been driven by the royalty payment component. From 2010 through 2016, franchise royalty payments have grown at a CAGR of 8.1 percent. This is 260 basis points greater than the growth in rooms revenue during the same period. Guest loyalty program payments (6.8%) also increased at a greater pace than rooms revenue the past seven year. Lagging in growth were marketing assessments (5.9%) and reservation fees (4.2%).
Management Structure Matters
Sixty percent of the properties in the study sample were owned and/or operated by the brand affiliated with the hotel. The remaining forty percent was either managed by the owner (non-brand), or operated by a third-party management company. Between the two management structures, we see differences in both the composition of the franchise fees, and how each component has grown since 2010.
In 2016, the components of franchise fee payments were more evenly distributed at the hotels operated by the brand. Since the brand is also earning management fees at these hotels, it can be assumed that they will alter components of the franchise fees as needed to win the management contract. At the brand-operated properties, the greatest share of franchise fees went towards the guest loyalty program (30.7%). However, the greatest growth in franchise fees at these properties since 2010 has occurred in the royalty payment (11.0% CAGR) component. Overall, total franchise fees at brand-operated hotels increased by a CAGR of 6.6 percent from 2010 to 2016, while rooms revenue grew by 5.5 percent CAGR.
At the hotels that are self-operated or managed by a third-party company, royalty payments (45.4%) dominate the total dollars paid to the franchisor. Since the brand is not receiving any management fees at these properties, they are less likely to negotiate any reductions in franchise royalty payments. From 2010 to 2016, the component of franchise fees the increased the greatest was the guest loyalty payments (9.2% CAGR). This is significantly greater than the increase in rooms revenue (5.6%) for these properties over the same period. Since the amount paid for guest loyalty program fees is influenced by the benefit received from these programs, it can be assumed that these hotels have received an increasing volume of business from loyalty program guests over the years.
Assessing Value
With the prospects for revenue growth limited for the next few years, hotel owners are paying particular attention to the costs associated with acquiring revenue. They want a better understanding if the investments they are making in distribution channels, management, and their brand are providing a sufficient payback.
When assessing the return they are getting for the franchise fees paid to their brands, owners also have the ability to dissect the value of the individual components. This enables them to make more specific comparisons to alternative brands, reservation systems, referral sources, management options, or even soft-brand alternatives offered by the franchisor.
About CBRE Group, Inc.
CBRE Group, Inc. (NYSE:CBRE), a Fortune 500 and S&P 500 company headquartered in Dallas, is the world's largest commercial real estate services and investment firm (based on 2023 revenue). The company has more than 130,000 employees (including Turner & Townsend employees) serving clients in more than 100 countries. CBRE serves a diverse range of clients with an integrated suite of services, including facilities, transaction and project management; property management; investment management; appraisal and valuation; property leasing; strategic consulting; property sales; mortgage services and development services. Please visit our website at www.cbre.com.
Robert Mandelbaum
Director of Research Information Services
CBRE Hotels


