Market Recovery Monitor - 30 July 2022
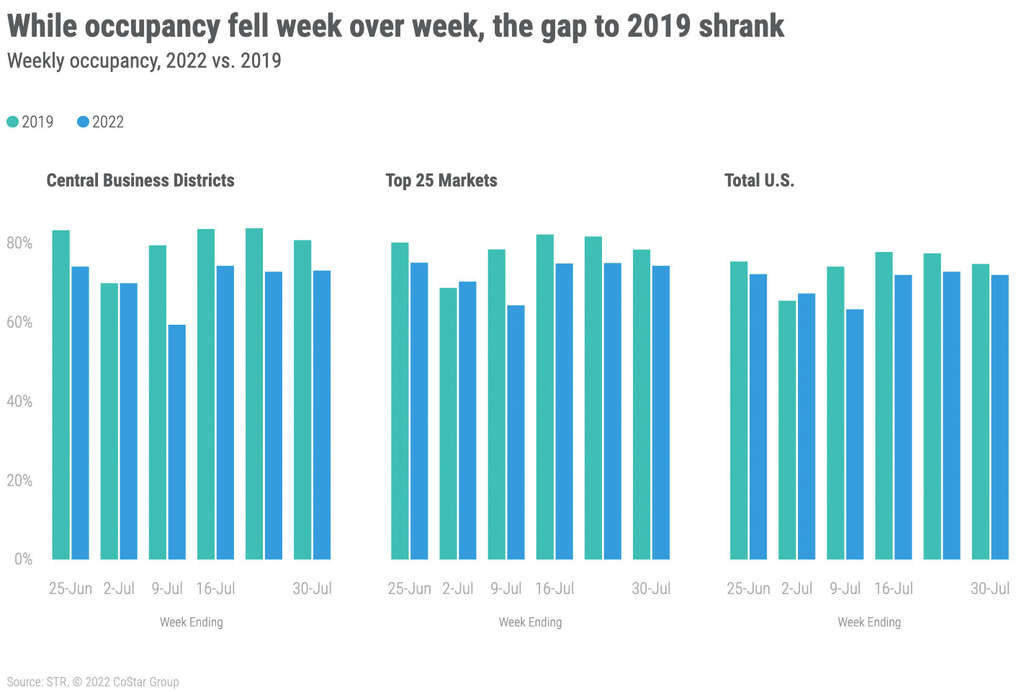
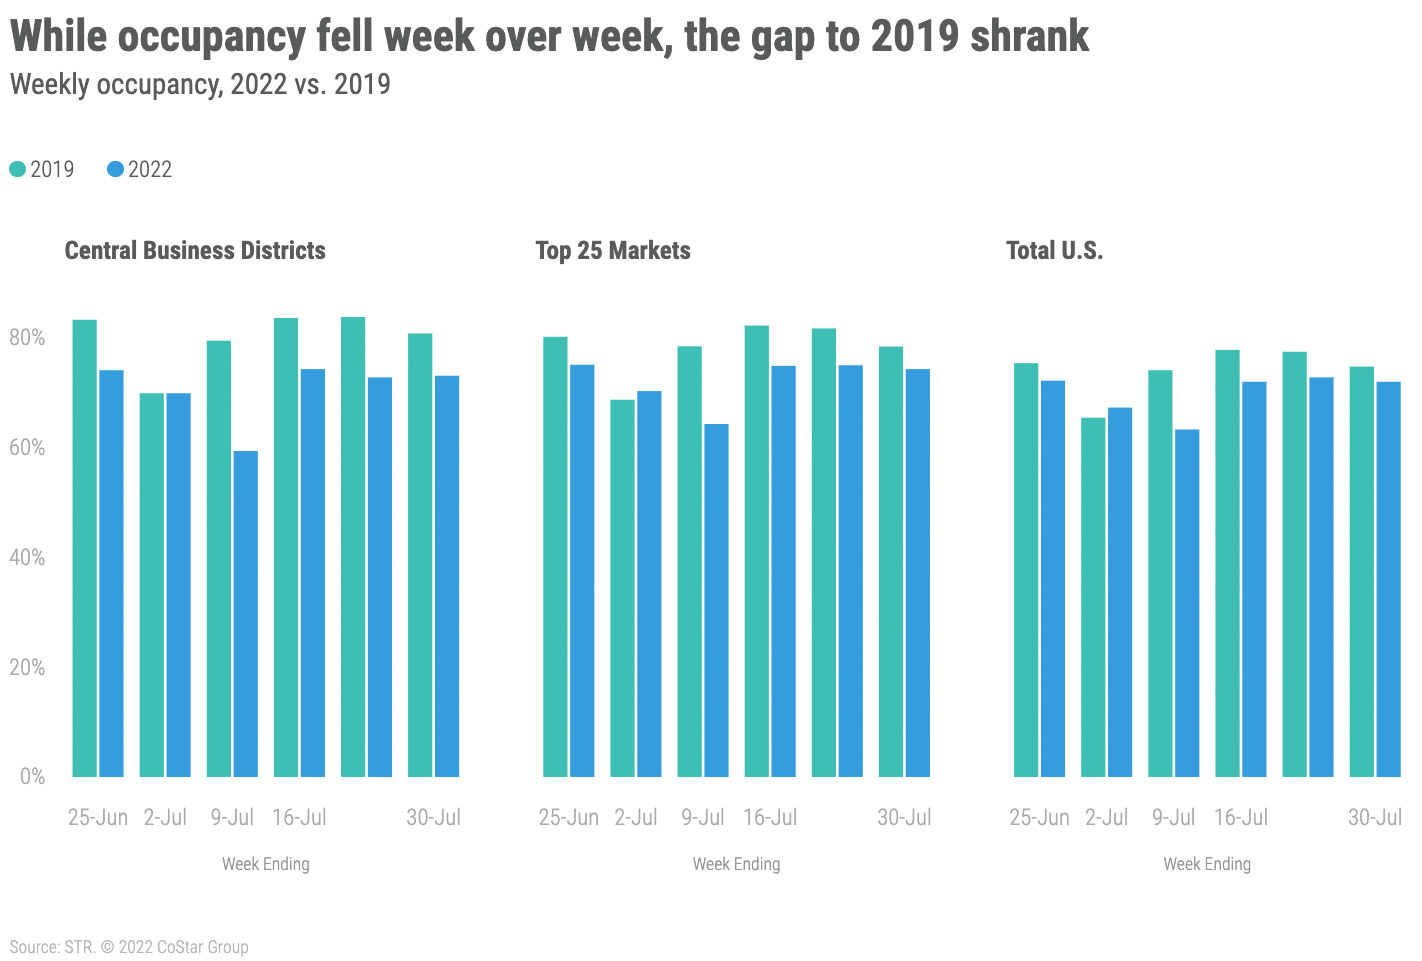
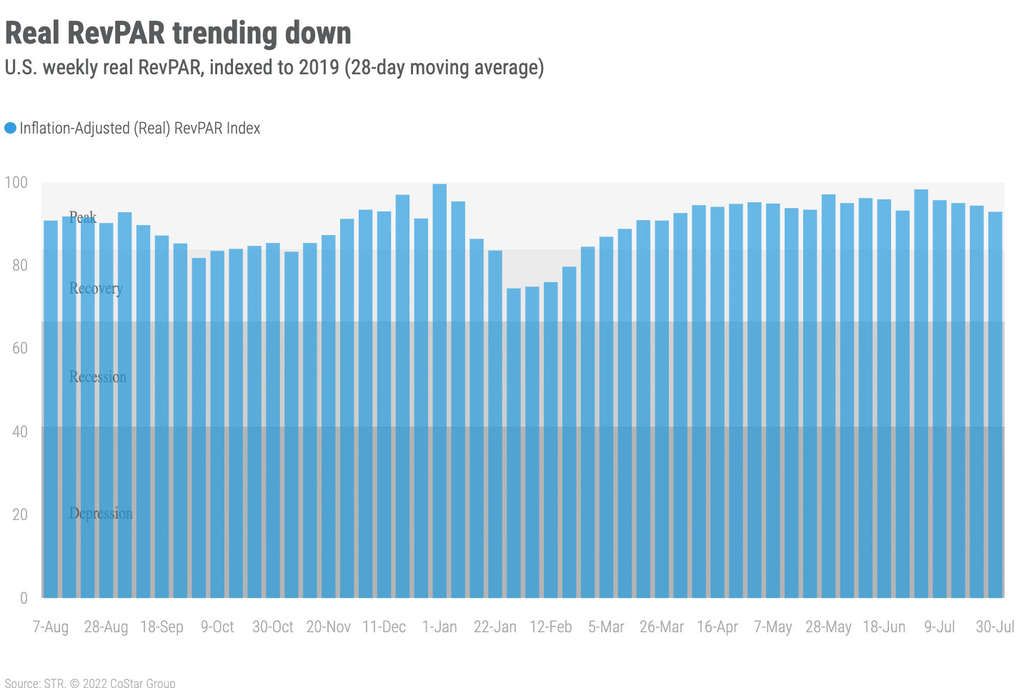
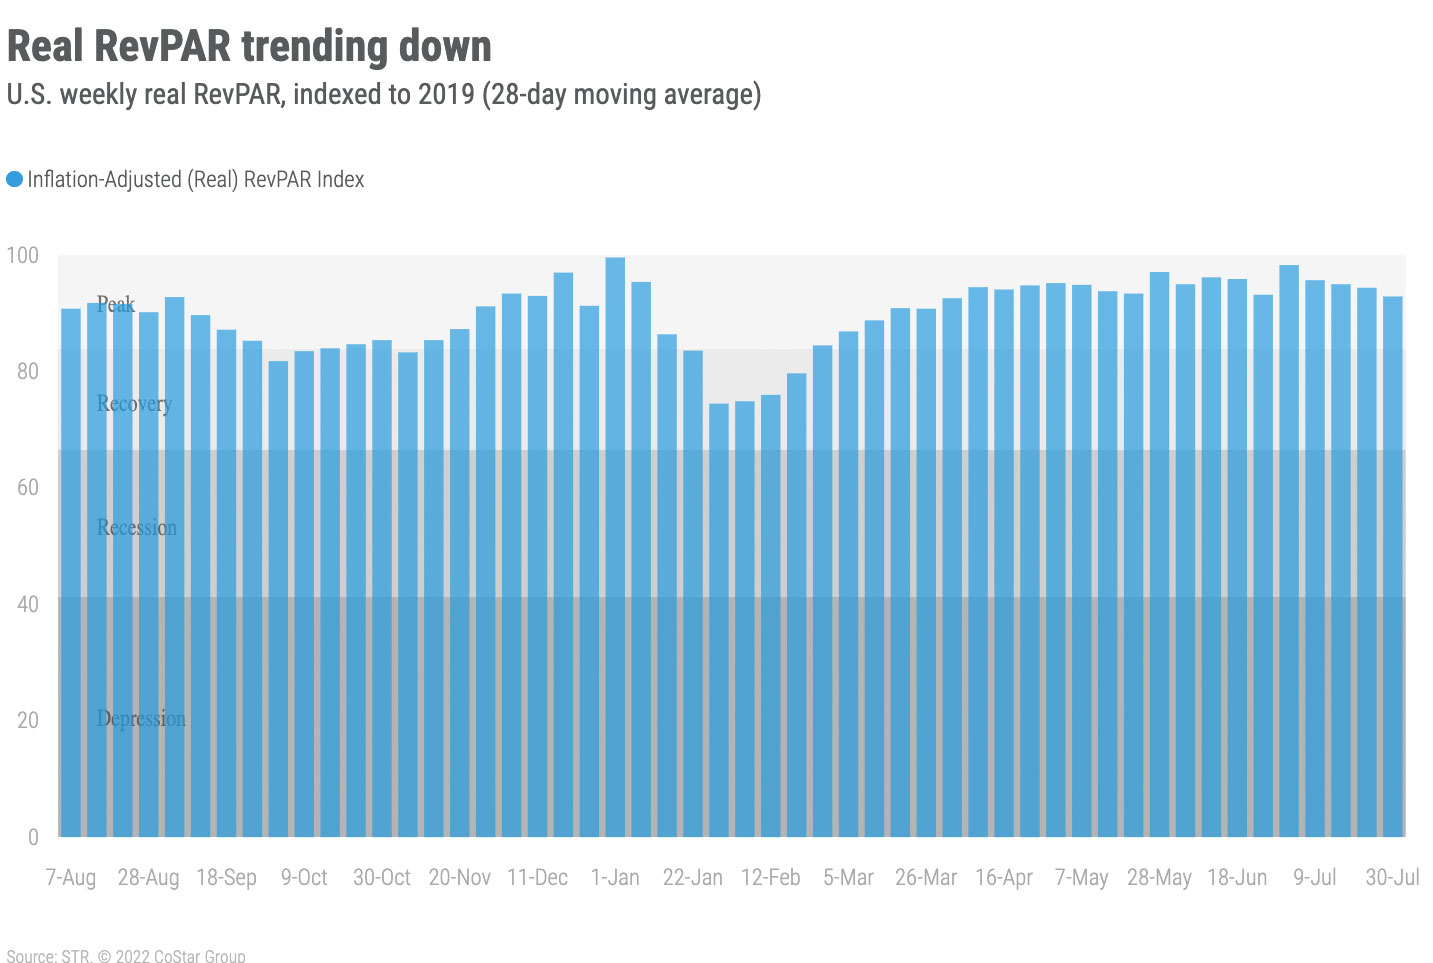
With the annual U.S. travel peak behind us, hotel demand and occupancy began to trend down—which is normal. For the week ending 30 July 2022 (week 31), however, the decrease in demand was much lower than in 2017, 2018 and 2019. In those years, demand fell by more than one million room nights week over week (WoW). This week, demand fell by only 316,000 room nights WoW, resulting in U.S. occupancy of 71.9%. That level was the fourth highest since the start of the pandemic and down just 0.8 percentage points from the week prior when the industry posted its highest occupancy since March 2020. Nominal average daily rate (ADR) was also down 0.5% WoW to US$158, which was 18% higher than in the comparable week of 2019 and 10.2% above a year ago. Nominal revenue per available room (RevPAR) decreased 1.6% WoW to US$114, but the index to 2019 increased for a third consecutive week with a level 14% higher than 2019 and 13% greater than a year ago. Real (inflation-adjusted) ADR was 3% higher than in 2019 whereas real RevPAR was one percent lower.
The week’s demand was strong. Comparing against other week 31s over the past 22 years, this year’s result was the third highest ever recorded behind 2019 and 2018, with the difference between 2022 and 2019 just 326,000 room nights. As compared with all weeks since 2000, the week ranked in the top quintile (22nd of the past 1,175 weeks). While not as high as initially expected, summer demand (weeks 23-31) has been strong, ranking as the fourth highest ever since 2000 behind 2019, 2018 and 2017 in that order. Summer occupancy thus far is 69.5%, as compared with 74% in 2019. A year ago, occupancy for the period was 68%.
The decrease in weekly demand was almost evenly divided between weekdays (Monday-Wednesday) and the weekend (Friday & Saturday), as together those two dayparts accounted for 85% of the total weekly demand loss. Markets outside the Top 25, however, made up all the weekend loss as the Top 25 saw a week-on-week gain during those two days. Occupancy in the Top 25 Markets reached 74%, down from 75% a week prior, with all other markets seeing occupancy of 71%, which was also one percentage point lower week over week. Top 25 weekday occupancy remained at or above 74% for a third consecutive week—it has been above 72% in seven of the past eight weeks. Weekend occupancy in the Top 25 Markets remained above 80% for a second straight week.
Top 25 Market occupancy ranged from 87% in San Diego to 58% in Phoenix. Two other markets (Houston and New Orleans) joined Phoenix with weekly occupancy below 60%. While its occupancy was low, room demand in Phoenix was 2% higher than in the comparable week of 2019. The other two markets mentioned saw room demand below 2019, but not by a significant amount (Houston -2% and New Orleans -5%). Ten of the Top 25 Markets, including Atlanta, Boston, Dallas, Miami, Nashville, and Orlando, saw this week’s demand surpass the level seen in the comparable week of 2019. Demand in Nashville was 22% higher. Five markets saw demand 10% lower than in 2019, including New York, San Francisco, Philadelphia, and Washington, DC. Demand in New York fell for a second consecutive week with the decrease coming on the weekdays as weekend demand was stable. Occupancy in Boston (86%) and Chicago (80%) reached pandemic-era highs with the latter boosted by the annual 4-day Lollapalooza music festival. Group demand, a stable for most Top 25 Markets, dropped slightly in the week with most of the decline coming on weekdays.
Upscale and upper midscale demand remained strong with both chain scales reporting their highest week 31 demand of the past 22 years. As compared to all weeks since 2000, demand for those two chain scales was among the top 10 all-time. Luxury and upper upscale continued to strengthen as compared with 2021 but remained below 2019 levels (~-8%). Midscale and economy have weakened since the start of the year. A year ago, midscale and economy were at or above 2019 demand levels, but this past week, both were below those levels. The downward shift in performance began in mid-March. Midscale has seen several weeks above 2019 since then, but economy has been mostly below the 2019 benchmark.
While nominal ADR declined week over week, it was still the third highest ever recorded going back to 2000. Real ADR was the 20th highest of all-time. Seven markets reported their highest nominal ADR of all time with only two STR-defined U.S. markets (Massachusetts Area and Wisconsin North) seeing the same via real ADR. Looking at the summer so far, nearly all markets (135 of 166) have their highest nominal ADR ever recorded, but using real ADR, only 24 markets, including Austin, Oahu, and San Diego, are at record highs.
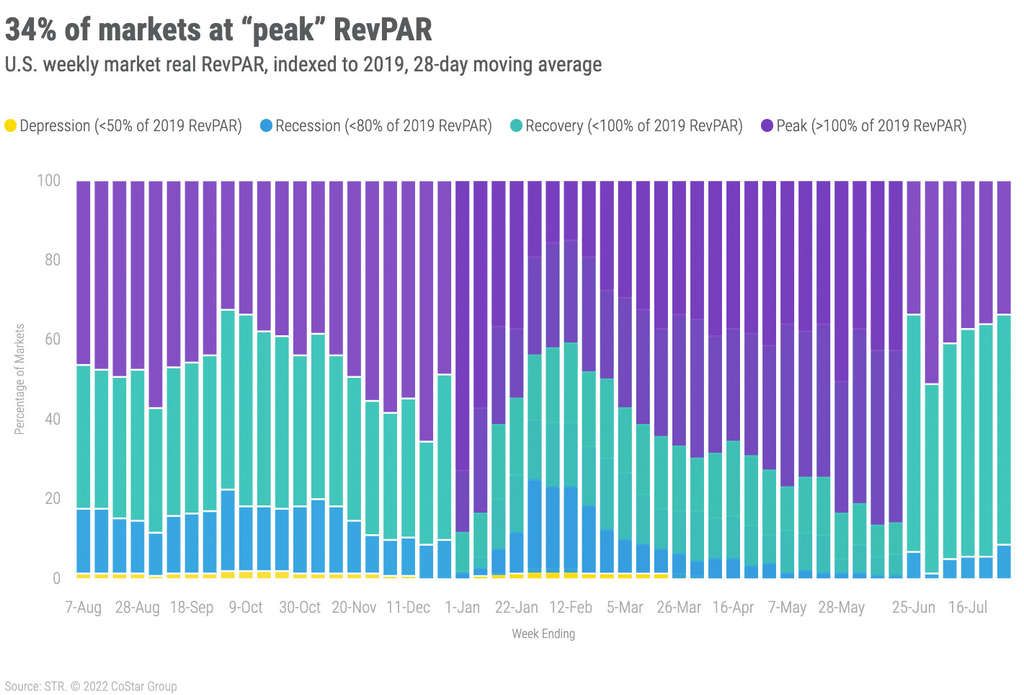
Nominal RevPAR was the second highest ever recorded and a result nearly all markets (87%) posting weekly RevPAR above the comparable week of 2019. What was even more surprising, 51% of markets were above 2019 using real RevPAR, the highest percentage of the past four weeks. Taking a longer view, on a 28-day basis, more than a third of all markets had real RevPAR above 2019, which we label as “peak.” Another 58% of markets (96) were in “recovery” as real RevPAR was between 80% and 100% of the 2019 level. Despite the solid summer, 14 markets were still in “recession” as real RevPAR was between 50% and 80% of the 2019 levels—Houston, Minneapolis, Portland, OR, San Francisco, San Jose, and Washington, DC were included in that group. San Francisco had the lowest 28-day real RevPAR comparison at 65% of 2019’s level.
Around the Globe
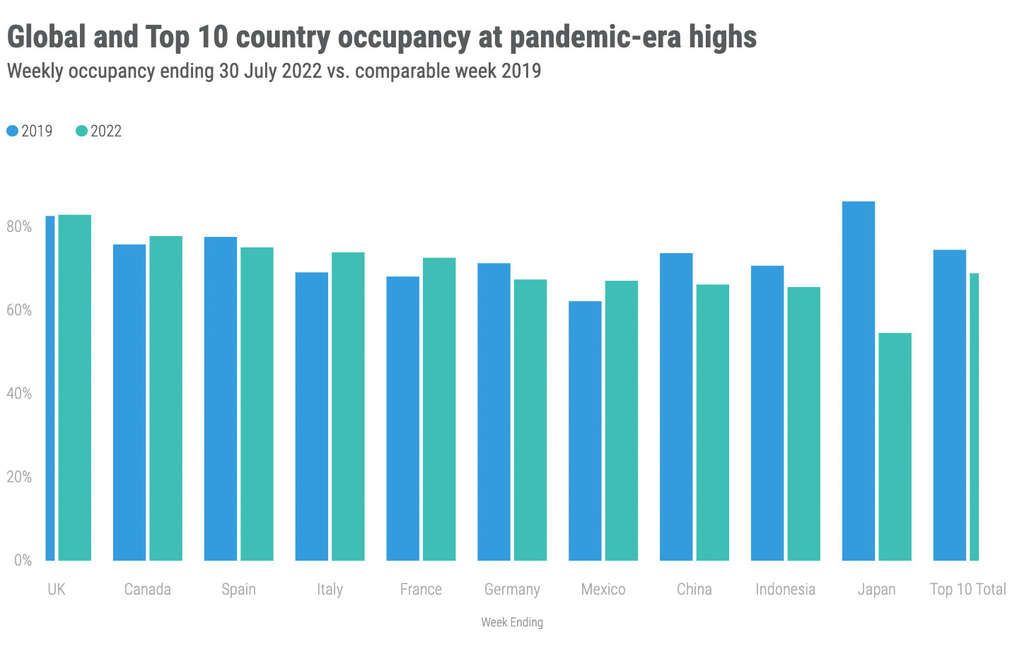
Outside of the U.S., occupancy increased 0.4 percentage points week over week to 67.8%, yet another pandemic-era high surpassing the level seen a week prior. While an improvement, the level was still 8.5 percentage points behind the comparable week in 2019. In all, 56 of the 103 countries tracked on a weekly basis saw a week-over-week increase in occupancy. Nominal ADR was basically flat (+0.2%) at US$148, which was the second highest level since March 2020 and 13% ahead of the 2019 comparable. Nominal RevPAR topped US$100 for only the second time since the start of the pandemic.
Hungary reported the largest gain in weekly occupancy, up 13.5 percentage points week over week, coupled with a 45.2% uptick in ADR. The Hungary Grand Prix, held in Budapest was the primary driver of the gain. China continued upward with a week-over-week occupancy increase of 3.9 percentage points to 66.1%, which was the country’s highest occupancy in more than a year. Hainan, a province popular for leisure visits, is leading the way, occupancy up 21.2 percentage points from the week prior. Tier 1 cities Beijing (+8pp), Guangzhou (+7pp) and Shanghai (6pp) saw increases, while Shenzhen fell behind the previous week by 5.4 percentage points, which was due to renewed COVID cases in the manufacturing center.
The Commonwealth Games kicked off in Birmingham on 28 July, boosting ADR levels by 36% WoW and 10.9% from the comparable week in 2019. Occupancy also rose 9.4 percentage points to 85.1%.
Ireland and Greece continued to report robust occupancy levels at 87.1% and 83.2%, respectively. Ireland surpassed 2019 levels by 2 percentage points, while Greece sits marginally behind. Northern Europe again saw the highest occupancy (82.4%) of any subcontinent, up 0.3 percentage points compared to the prior week, with Central America with the lowest (56.2%)
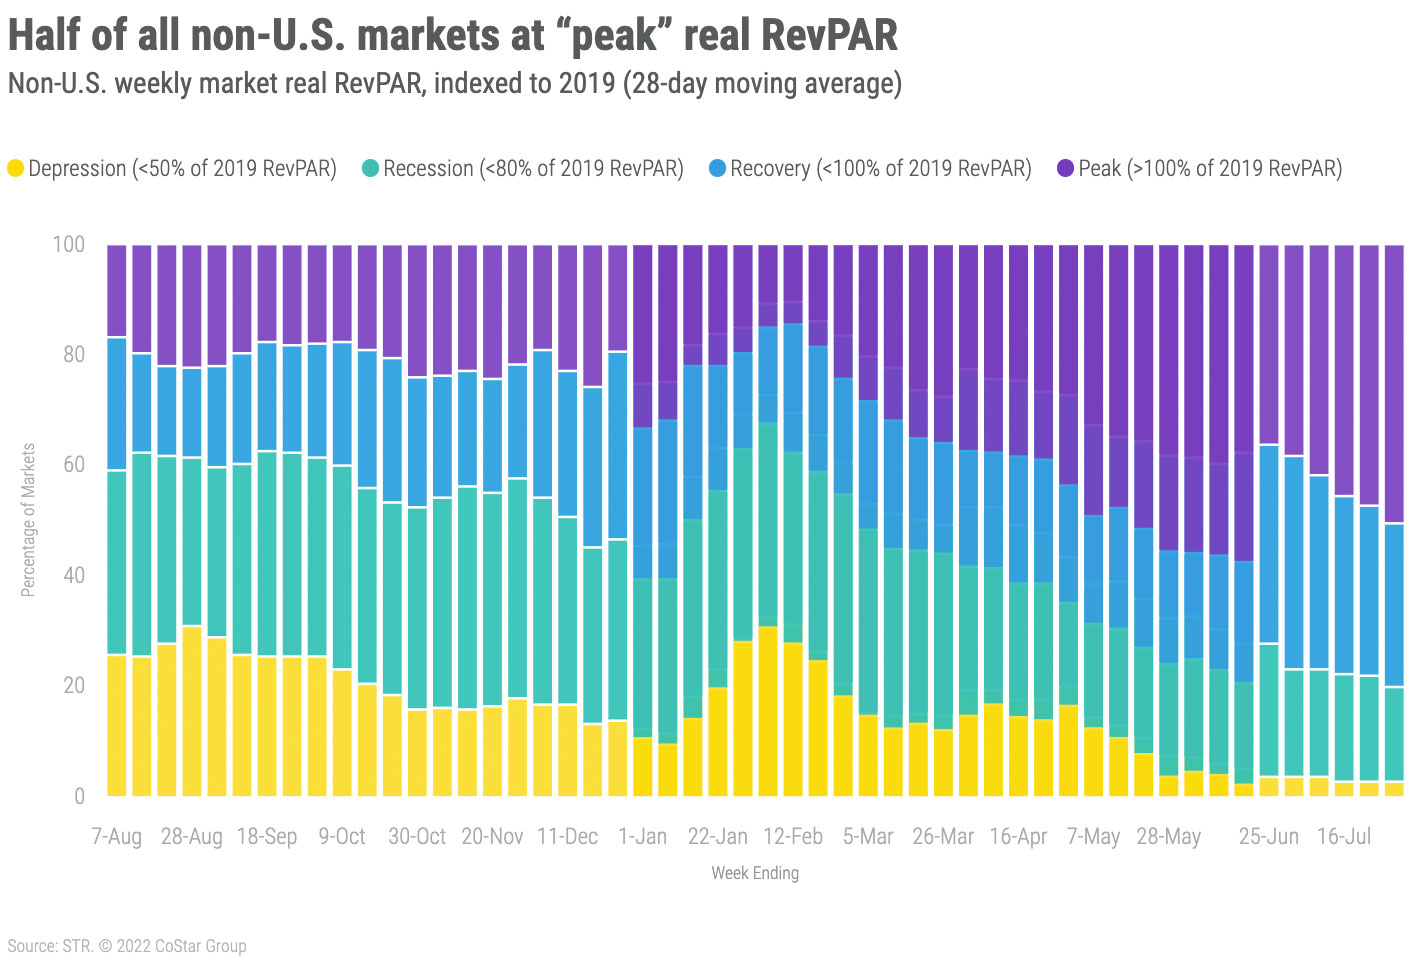
Over the past 28 days, 17% of non-U.S. markets remained in “Recession” (real RevPAR indexed to 2019 between 50 and 80) while 3% were in “Depression” (real RevPAR indexed to 2019 under 50). On the positive side, 51% of non-U.S. markets had real RevPAR above the comparable 2019 level. This was the highest percentage since the start of the pandemic.
Big Picture
So now what? Pundits, operators, and everyone in between are debating the fate of the industry as we head toward the fall in the northern hemisphere. Our contacts continue to tell us of a solid to strong fall ahead, led by groups. There are also some that point to pent-up business demand filling in the space left by the summer leisure traveler. Despite the increased recession focus, demand remains on solid footing with levels at a good place historically. None of us have a crystal ball, but at this point, the rhetoric is not aligned with actualized demand.
About STR
STR provides premium data benchmarking, analytics and marketplace insights for the global hospitality industry. Founded in 1985, STR maintains a presence in 15 countries with a corporate North American headquarters in Hendersonville, Tennessee, an international headquarters in London, and an Asia Pacific headquarters in Singapore. STR was acquired in October 2019 by CoStar Group, Inc. (NASDAQ: CSGP), the leading provider of commercial real estate information, analytics and online marketplaces. For more information, please visit str.com and costargroup.com.
