Market Recovery Monitor - 13 August 2022
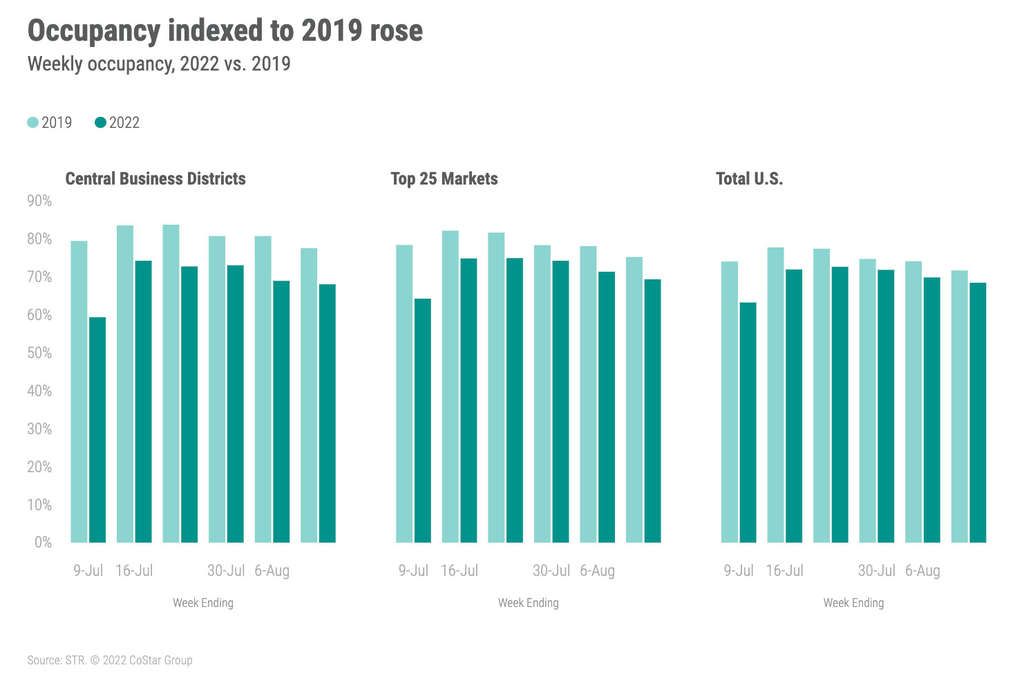
The deceleration in U.S. hotel room demand continued as the final days of summer near. For the week of 7-13 August 2022, demand declined by 558,000 rooms week over week (WoW) with occupancy dropping to 68.5%. The WoW decrease in demand (-2%) was less than expected. In 2011, which has the exact same calendar composition as this year, weekly demand fell by more than 3%. Overall, the week’s demand was 98% of the 2019 comparable. Nominal average daily rate (ADR) also softened, falling 1.5% WoW to US$152 but up 8.5% year over year (YOY). Nominal revenue per available room (RevPAR) decreased 3.5% WoW to US$104, which was 13% higher than a year ago. Both nominal ADR and RevPAR remained well ahead of 2019 levels. Real ADR (inflation-adjusted) was equal to 2019, but real RevPAR was 5% lower. All performance measures have decreased for the past three weeks, coinciding with the start of K-12 schools, mostly in the south.
All day parts saw a decline in performance with the largest week-on-week decrease occurring over the weekend (Friday & Saturday), which accounted for 59% of the total decline in weekly demand. Nearly three quarters of all markets saw weekend demand fall. Among decliners, Orlando saw the largest drop in demand, accounting for 8% of the demand loss. Baltimore, Chicago, Los Angeles, and Minneapolis rounded out the five steepest declines with those four markets making up 14% of the total weekend loss among the markets losing demand. Markets that gained weekend demand—41 in total—included Boston, Miami and Pittsburgh.
Weekday (Monday-Wednesday) demand was fairly stable, falling by only 34,000 rooms week over week with all of the aggregate decline coming from the Top 25 Markets. Twelve of the Top 25 Markets saw weekday demand fall with Orlando posting the largest decrease (-20,000). Other decliners included Atlanta, Los Angeles, Nashville, San Francisco, San Diego, and Tampa. Together, these 12 markets lost 91,000 weekday room nights, offset by a gain of 57,000 in the remainder of the Top 25. Weekday gainers included Boston, Chicago, Dallas, Houston, and Washington, D.C. Weekday occupancy for the Top 25 Markets was 69%, which was that group’s second week below 70% since mid-July. Weekday occupancy for central business districts (CBDs) was also below 70% at 67%, but up one percentage point week over week. Group demand, a key demand driver of the Top 25 Markets and CBDs, declined slightly week over week but was 95% of what was seen in 2019. We expect group demand to be flat to down until Labor Day. Thereafter, we should should see a robust increase through the end of October with some up and downs given holidays along with the Jewish religious observances in late September and early October.
While as an aggregate the Top 25 Markets were responsible for the weekday demand decrease, several markets outside the Top 25 also saw demand fall with the largest declines seen in Greensboro/Winston Salem (-17,000), the Florida Panhandle (-13,000), and Pittsburgh (-9,000). These decreases were offset by gains in other non-Top 25 Markets.
The highest weekly occupancy was in Portland, ME (93%) followed by Alaska (90%) with the lowest level in Macon/Warner Robbins, GA (50%). New Orleans saw the second lowest weekly occupancy (53%) and has seen occupancy below 60% for the past six weeks.
Occupancy in New York City remained above 70% as it has in 21 of the past 22 weeks. The market’s level (77%), however, was its lowest of the past 11 weeks. Room demand was at 83% of the 2019 comparable with ADR (US$191) 8% higher than in the comparable week of that year.
Summer travel season is still trending as the fourth best of the past 22 years. Nineteen markets, including Austin, Atlanta, Dallas, and Nashville have seen record hotel demand for the period. Atlanta has sold 5.8 million summer rooms thus far versus its previous high of 5.7 million rooms seen in 2019. On the flip side, this summer ranks 20th out of 22 for San Francisco. Summer room demand for the city has been 3 million to date as compared with 3.7 million in 2018. Maui and Oahu are also observing summer demand that is near the bottom versus previous years. However, for most markets (63%), this summer is ranked among the top five best.
Nominal ADR has been above 2019 for the past 27 weeks with the most recent week’s level 16% higher than in the same week of 2019. Real ADR, however, fell below 2019 in each of the past two weeks. Prior to the fortnight, real ADR had been above 2019 since mid-May. Overall, 98 of the 166 STR-defined U.S. markets had real ADR above their 2019 comparable. Maui had the largest increase with real ADR 41% higher than what it was in 2019--Maui nominal ADR this week was US$654, which was also the highest ADR of any market this week. San Jose and San Francisco both had a 22% deficit in real ADR to 2019. All-time highs in real ADR were seen in two markets during the week: Washington State and Portland, ME. While Maui had the highest nominal and real ADR of any market this week, its weekly level was its 28th best since 2000.
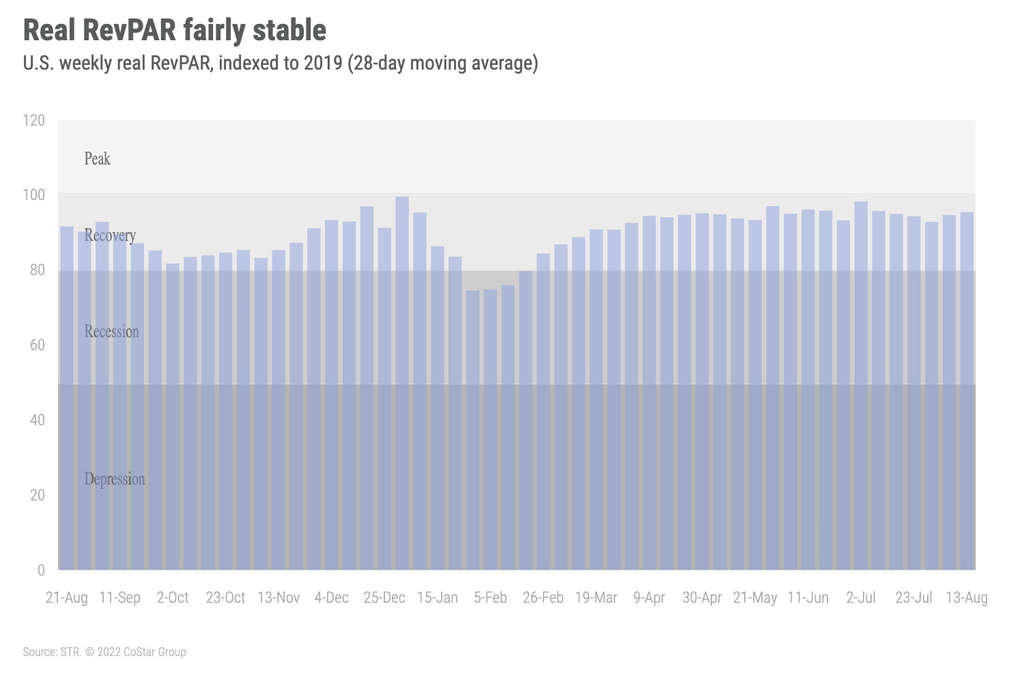
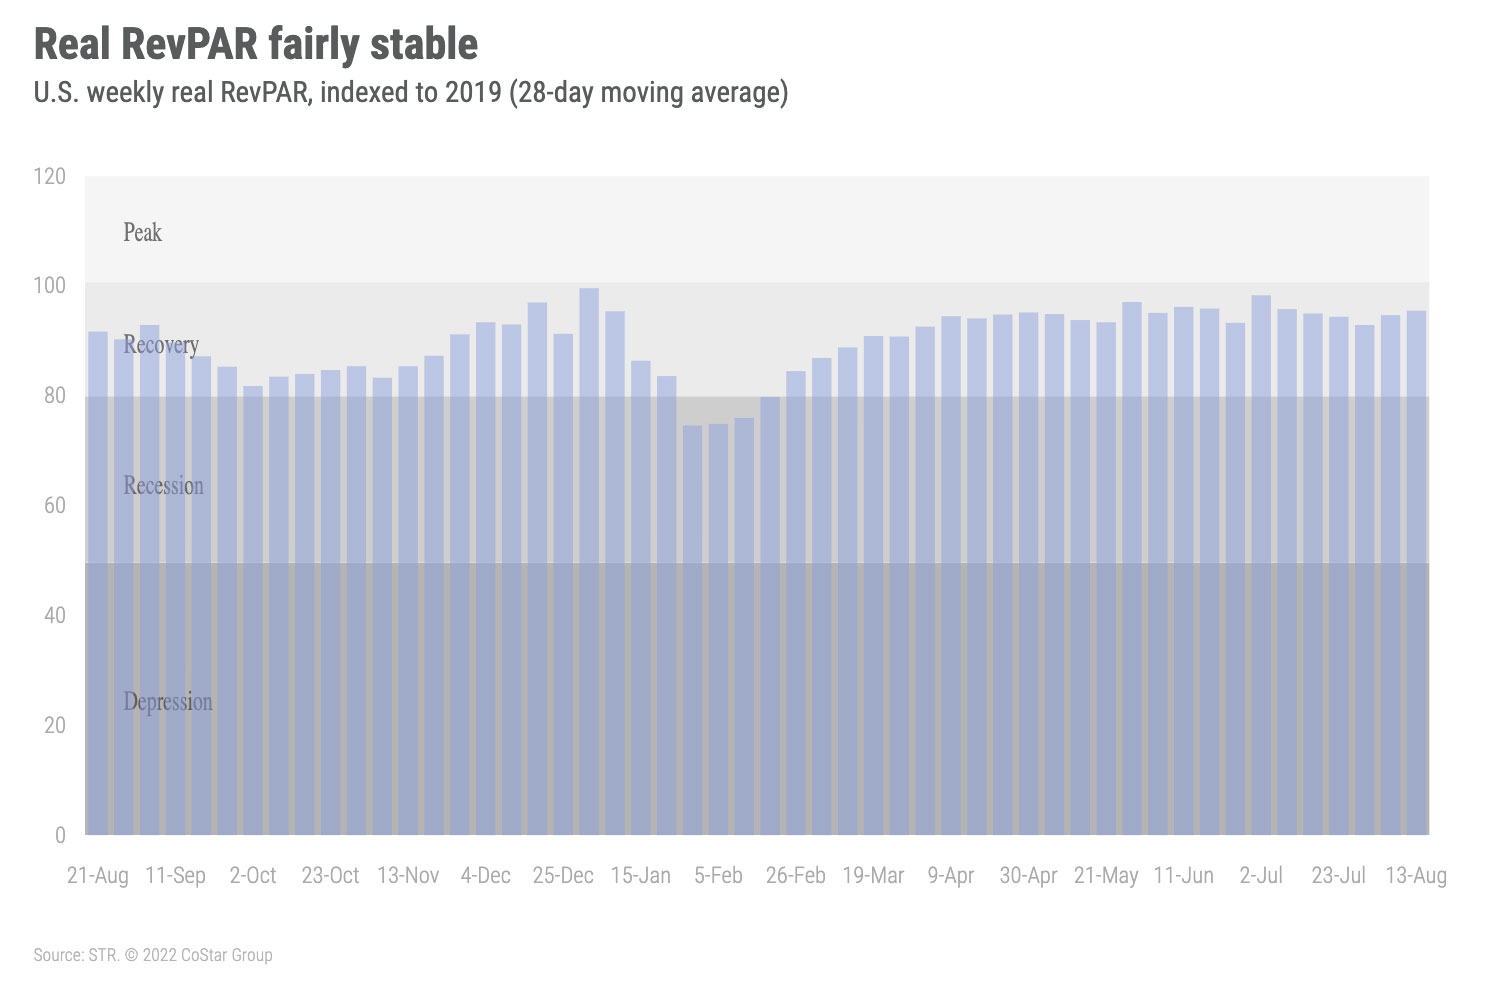
Real RevPAR has only surpassed 2019 three times this year. The most recent week, however, was an improvement over the previous week as real RevPAR was 5% under 2019 versus 7% less a week ago. Nearly half (48%) of all markets had real weekly RevPAR above 2019 this week versus 85% of markets when comparing nominal RevPAR. Smaller markets—Georgia North, Missouri South, Hawaii/Kauai, and South Dakota—had the highest real RevPAR premiums to 2019, all more than 30% higher than in 2019.
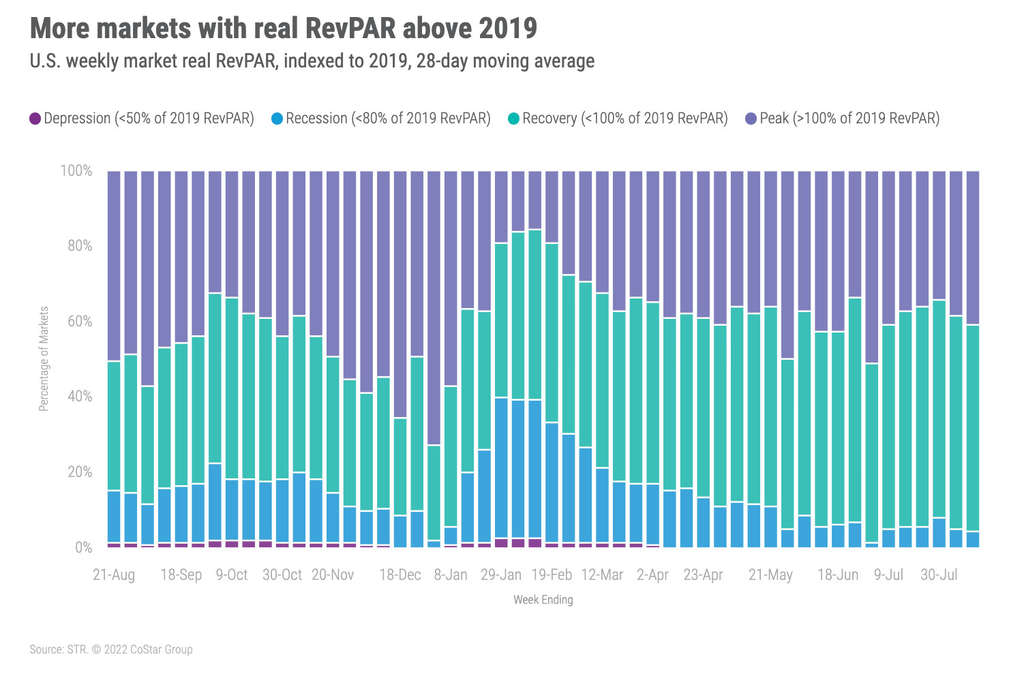
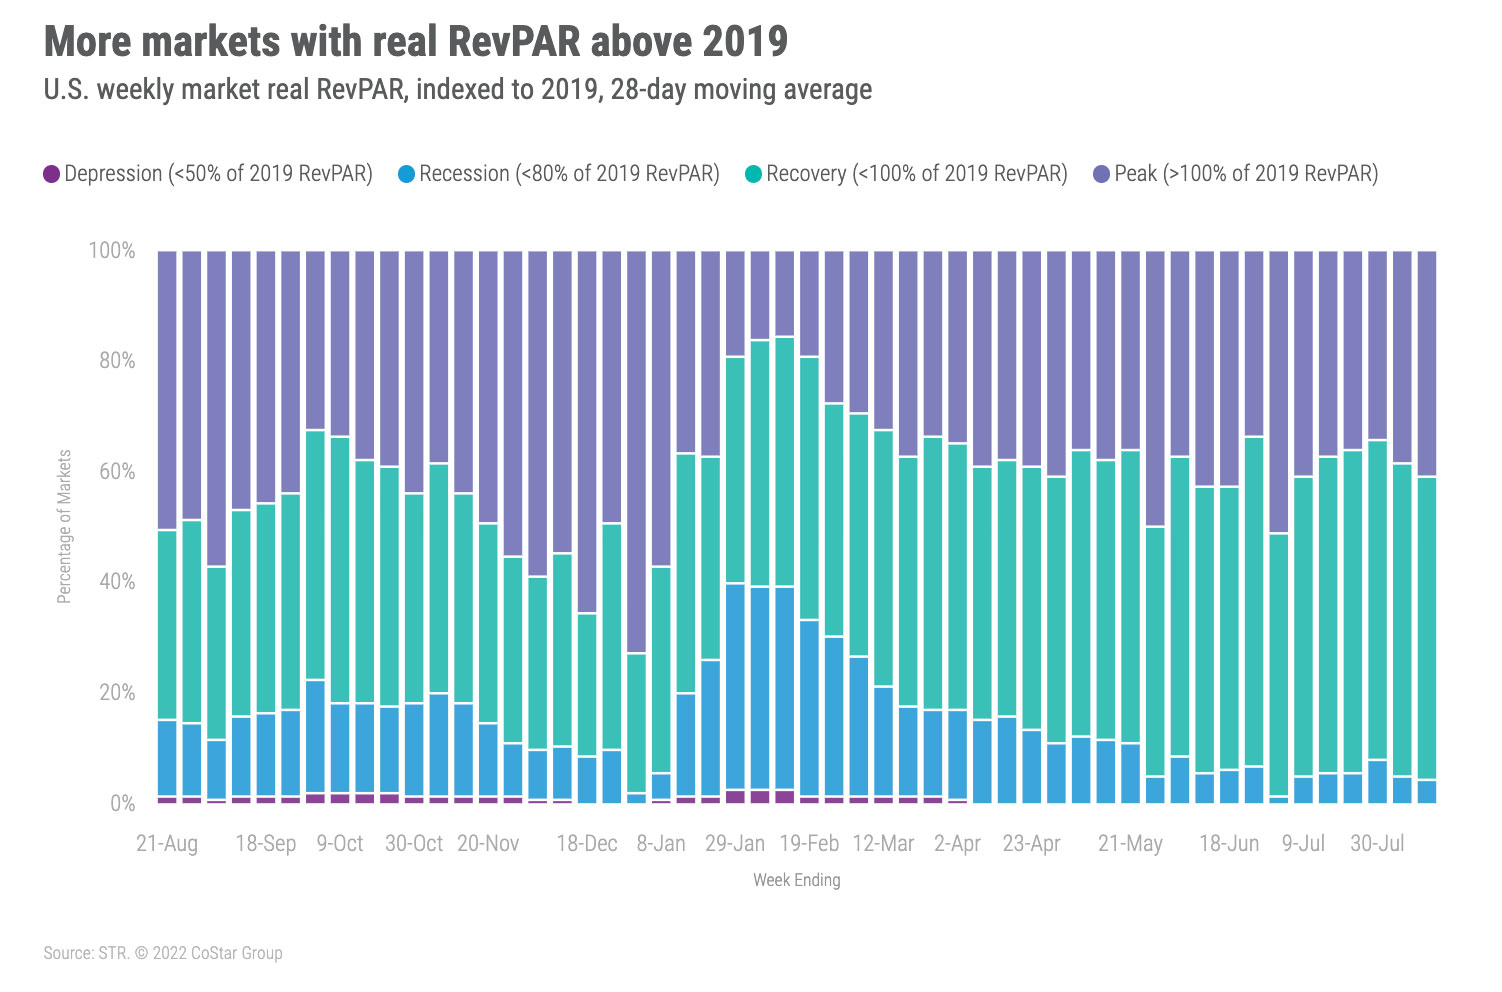
Over the past 28 days, real RevPAR was above 2019 in 41% of markets, which we label as “peak.” Another 55% were in “recovery,” meaning real RevPAR was between 80% and 100% of 2019 RevPAR. Seven markets, including San Francisco, San Jose, and Portland, OR, are in “recession” as real RevPAR was between 50% and 80% of 2019’s level.
Around the Globe
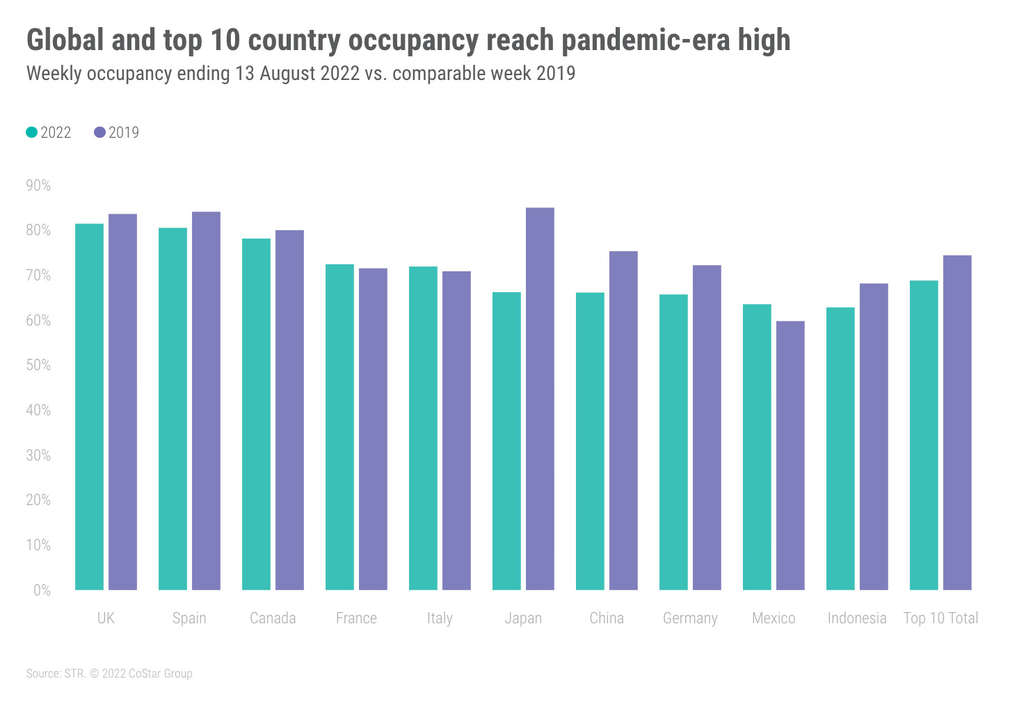
Excluding the U.S., global occupancy reached a pandemic-era high of 68.5%, up 1.2 percentage points WoW. Since May, global occupancy has increased in every week except three. Nominal RevPAR (US$102) also reached a pandemic-era record, increasing by nearly 4% WoW. Nominal ADR was the second highest since the start of the pandemic (US$149), up 2% WoW.
Slovenia had the highest weekly occupancy of any country (92%) followed by Ireland (87%) and Portugal (87%). Among the top 10 countries based on supply, the United Kingdom had the highest occupancy (81%) followed by Spain (81%), Canada (78%), and France (72%). Only two of the top 10 countries saw occupancy below 65%: Mexico and Indonesia.
For the first time in 10 weeks, occupancy in China fell, dropping to 66% from 67% a week ago. Demand fell sharply in Xiamen, Chongqing, China Northwest Provincial, and Sanya along with 20 other markets. Shanghai, Chengdu, and Beijing saw solid growth. Occupancy in Shanghai reached a 12-week high of 54%.
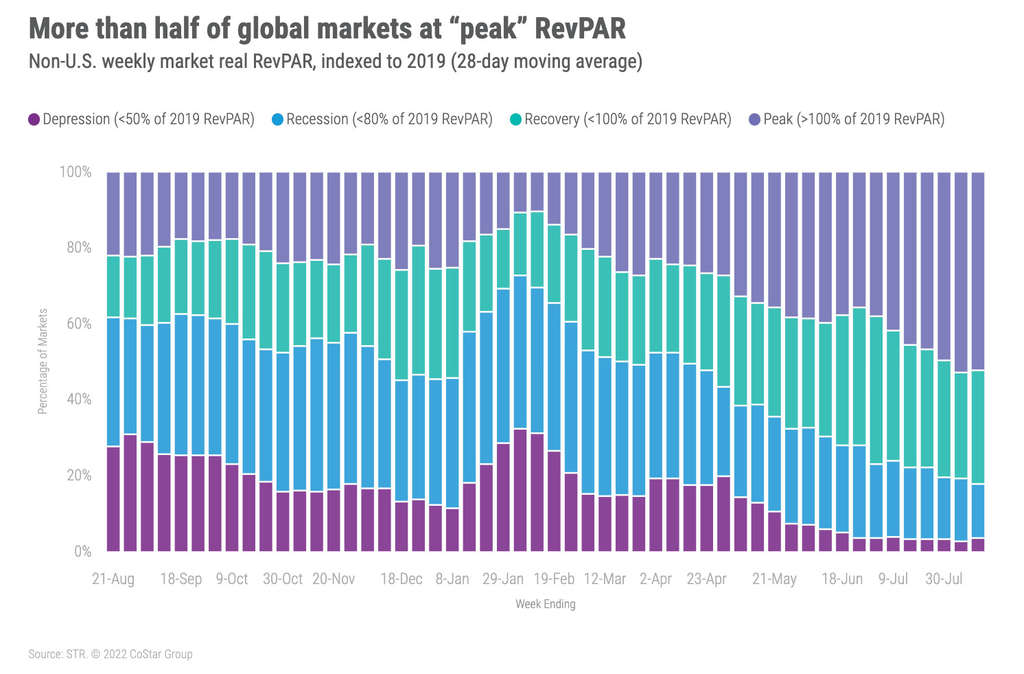
In the last 28 days, 52% of the 344 non-U.S. markets had real RevPAR at “peak” (above 2019) with another 30% in “recovery.” Twelve markets, including Chengdu, Macau, and Shanghai were in “depression” as real RevPAR was less than half of what it was in 2019.
About STR
STR provides premium data benchmarking, analytics and marketplace insights for the global hospitality industry. Founded in 1985, STR maintains a presence in 15 countries with a corporate North American headquarters in Hendersonville, Tennessee, an international headquarters in London, and an Asia Pacific headquarters in Singapore. STR was acquired in October 2019 by CoStar Group, Inc. (NASDAQ: CSGP), the leading provider of commercial real estate information, analytics and online marketplaces. For more information, please visit str.com and costargroup.com.
