The Merchant Model Effect on ADR, RevPAR & Profitability
Is stating that the industry standard of ADR and RevPAR "is an imperfect science" a provocative statement?
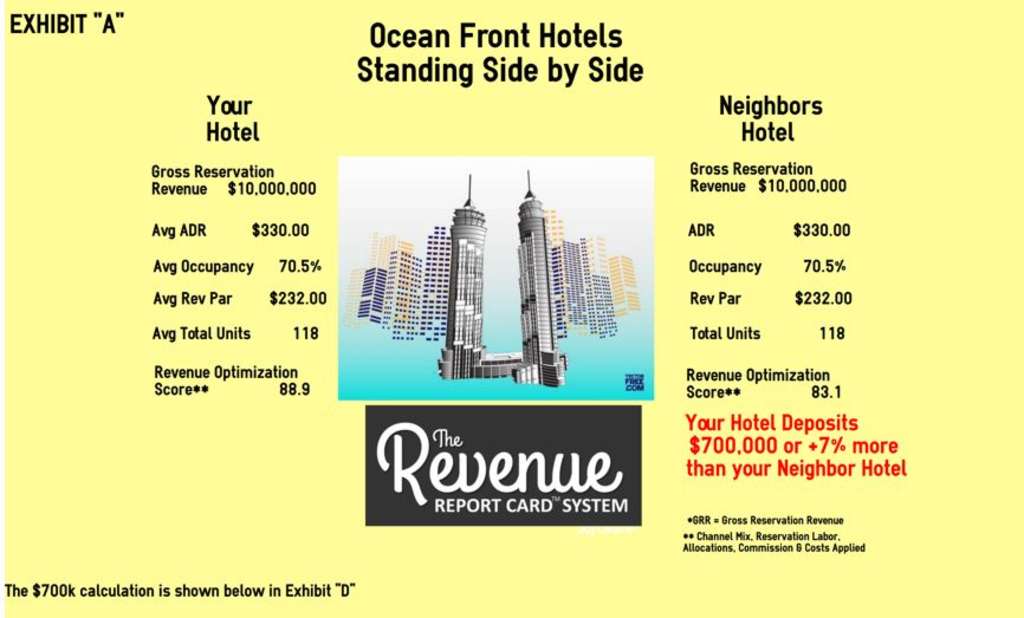
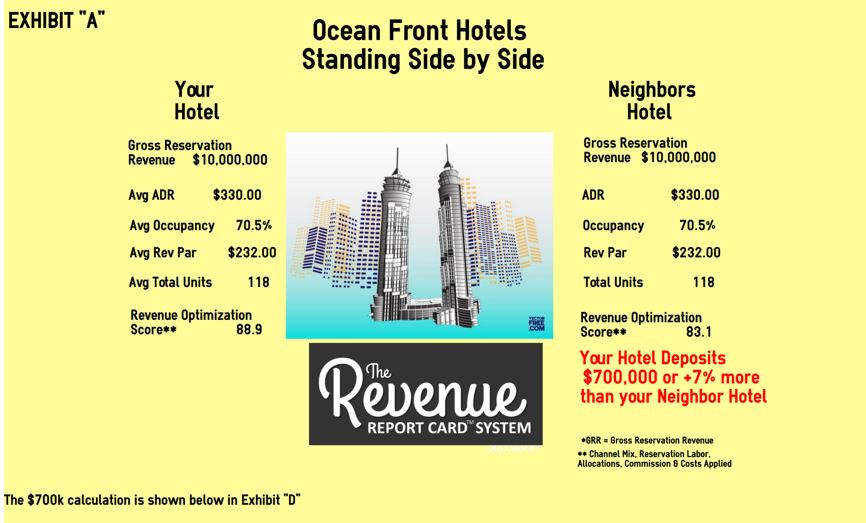
Two ocean front hotels (Exhibit "A") sit side by side; each has the exact same ADR, Occupancy, Number of Units and RevPAR. Yet "Your Hotel" deposits and shows a net profit of $700,000 more than 'Your Neighbors Hotel" because of "channel mix" and the "merchant model effect".
The "merchant model" of payment has been used by wholesalers, receptive-operators and until recently, most on-line travel agents (hereafter "OTA's"). The merchant model effect is a game changer in analytics.
The Problem
The industry currently calculates Average Daily Rate (hereafter "ADR") and RevPAR by combining the revenues of two uniquely different payment-sources. The first has their customers pay the hotel in full at check-in (they are paid their commissions at a later date by hotel check, credit card or ACH) and the second, a third party, accepts full payment directly from the customer and then removes their commission before paying the hotel (this is called paying the hotel in NET / or is a company that has a Merchant Model relationship with the hotel).
It's easy to see the flaw here; we're combing two totally different payment methods and treating them as if they were the same when we calculate hotel Gross Reservation Revenue. But in doing this we are mixing apples and oranges!
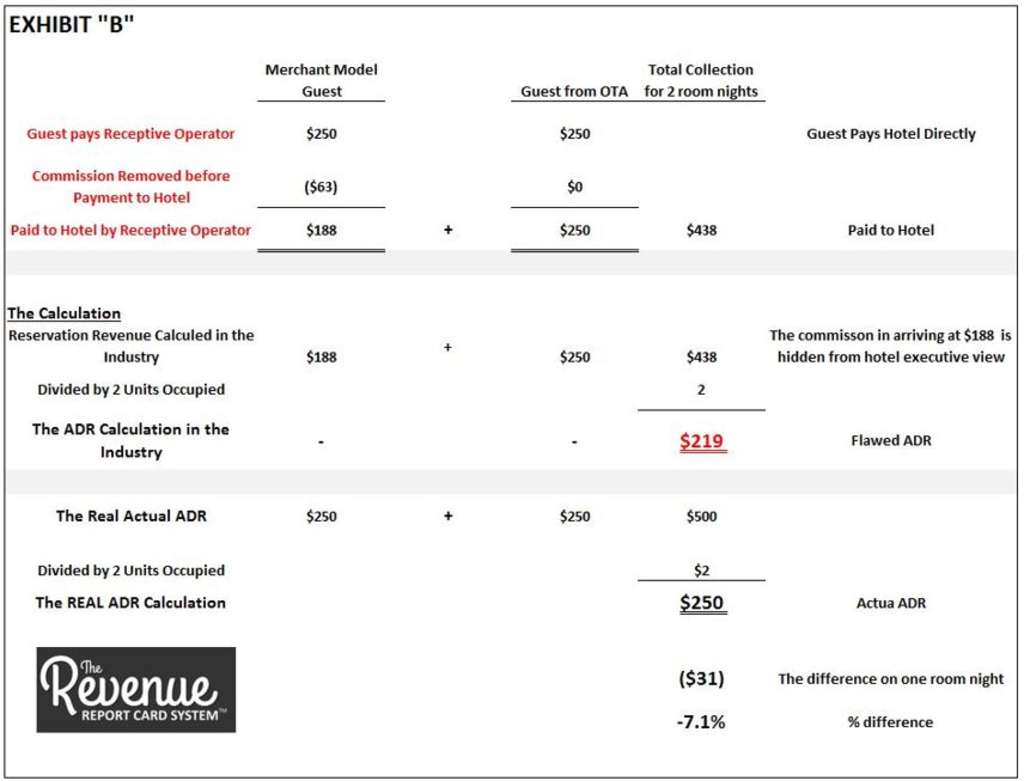
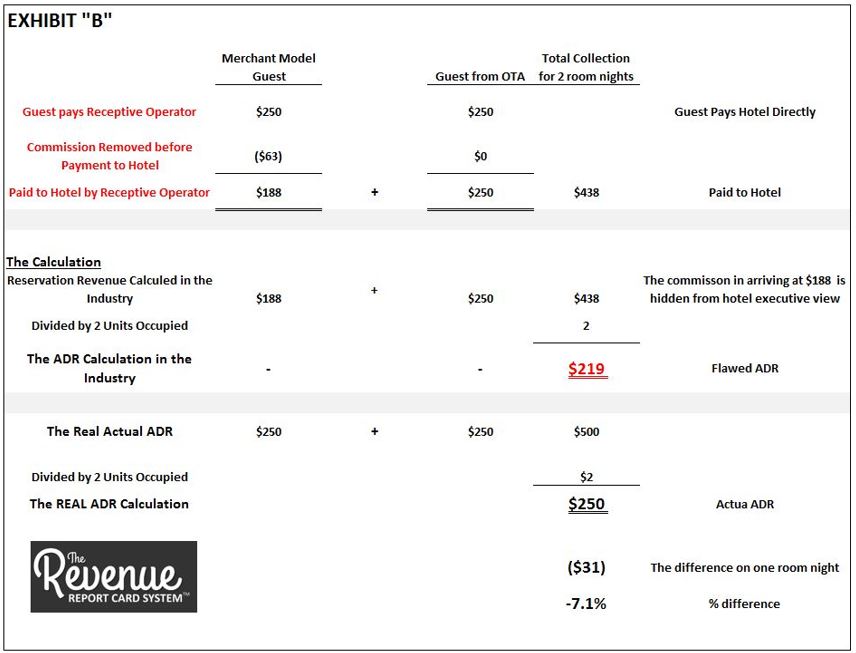
The case is best shown when one guest pays the Receptive Operator $250 for a one night stay at your hotel (using the merchant model in paying the hotel) and another guest pays "Your Hotel" $250 in the full amount (without the commission removed). Exhibit "B".
For simplicity's sake, let's assume the hotel is paying (1) direct pay and (2) merchant model reservation sources a 25% commission.
The Receptive Operator sends a payment to the hotel for that night for $187.50 ($250 - $62.50 commission).
The OTA, on the other hand, has the client pay the hotel $250 at check-in in the full amount for that night.
The hotel, on that evening, accrues/collects a total of $437.50 from both transactions ($250.00 + $187.50).
The industry standard ADR calculation takes total Gross Reservation Revenues of $437.50 and divides that amount by the 2 room nights occupied for an ADR of $218.75. The reality however is that both guests paid the same $250 to stay at the hotel and so doesn't that mean that the real ADR should be $250 ($500 / 2 units occupied)?
Further, the industry standard RevPAR calculation also uses total Gross Reservation Revenues of $437.50 and divides that amount by the total units available to sell that night. To simplify the example, let's assume here that hotel occupancy, on this night was 50%, and that the hotel had a total number of 4 units available for sale. The RevPAR calculated by industry standard would be $109.38. But as before, the dilemma is that the real RevPAR should be $125 ($500 / 4 units available for sale that night).
The hotel financial statement (shown on Exhibit "C in the left column) shows total Gross Reservation Revenues of $437.50 ($500 less merchant model commissions of $62.50 for the merchant model transaction). The "Commission Expense" line item below Gross Reservation Revenues is from the other, non-merchant model transaction, in the amount of $62.50. You can see the inconsistency here.
The Net Income in both cases is $375.00. Yet the merchant model business commission "is hidden" within the Gross Reservation Revenue line (circled in red above).
The outcome is that the hotel executive never sees or is able to visually quantify this part of the cost equation; Gross Reservation Revenue is reduced with no explanation and, in turn, ADR and RevPAR are also reduced.
One can only draw the conclusion then, when comparing "Your Hotel" to your competitive set, that the standard industry calculation of ADR and RevPAR is an imperfect science; unless all hotels in your Competitive Set have exactly the same Channel Mix.
The Calculation: How did we get to the $700k differential?
Let me show you how, in this case, "channel mix" coupled with "merchant model" contribution allowed "Your Hotel" to outperform "Your Neighbors Hotel" by $700,000 despite all industry standard metric evidence to the contrary.
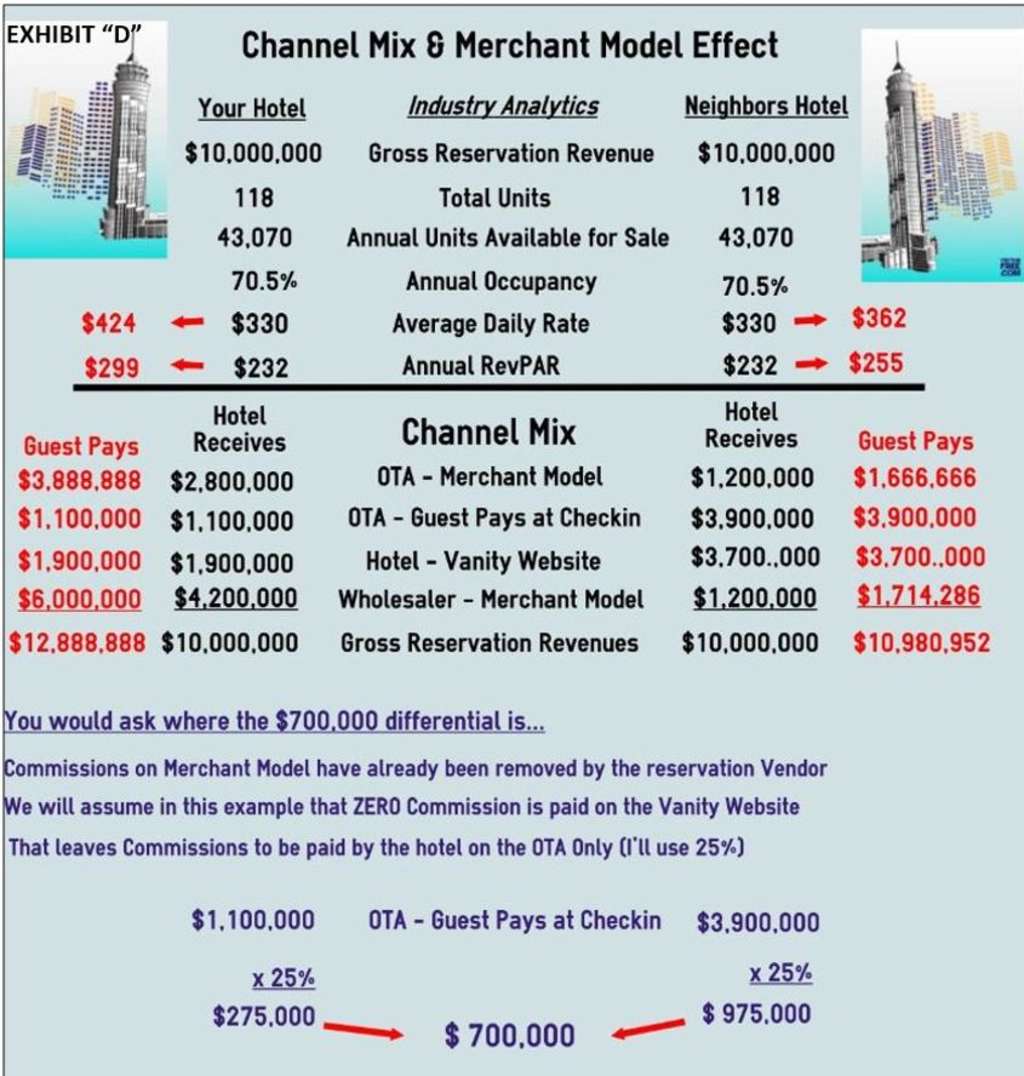
Exhibit D above, entitled "Channel Mix & Merchant Model Effect" shows "Your Hotel" and "Your Neighbors Hotel" are each using four revenue channels in your revenue channel mix. Two sources are full payment straight to the hotel and two sources are net payment via the merchant model arrangement.
- OTA merchant model,
- OTA guest pays full amount at check-in,
- Hotel – Vanity Web Site guest pays full amount at check-in,
- Wholesale merchant model.
Each hotel shows Gross Reservations Revenues of $10,000,000.
Each hotel has 118 rooms available for sale and uses industry standard calculations that show ADR of $330, Occupancy Percentage of 70 ½ % and RevPAR of $232.
The only difference that separates "Your Hotel" from "Your Neighbors Hotel" is Channel Mix.
Here's where the two hotel performances part ways. If you take a specific look at the two merchant model channels I identified above ((1)OTA Merchant Model and (2) Wholesale Merchant Model) you can see the large hidden differentials between the columns that show what the "Guest Pays" and what the "Hotel Receives" (below). As I've said the hotel executive can not see this differential on a financial statement.
Let's look at the "OTA – Merchant Model" line item, specifically to see that the OTA using the merchant model method in collecting $3,888,888 directly from the guest and then they turn around and pay "Your Hotel" $2,800,000 for that business. As already stated the $1,088,888 that was the OTA commissions are not seen by anyone. Secondly, both (1) your financial statement and (2) your industry calculated ADR & RevPAR uses that $2,800,000 in Gross Reservation Revenues when they calculate your ADR and RevPAR.
Now please go to upper portion of Exhibit "D" and look at the line entitled "Average Daily Rate" and the line entitled "Annual RevPAR" and you will see that despite that your industry calculated ADR and RevPAR shows $330 and $232, respectively… the actual ADR and RevPAR should be $424 and $299 after placing all channels on an equal playing field (here we simply add back the commissions that were withheld in merchant market arrangements). The substantial differences of $94 and $67 tell the true tale of the tape regarding real ADR & RevPAR when all channels are placed on an equal playing field.
As important, you can now compare your actual ADR & RevPAR of $424 and $299 to that of your neighbor's hotel (or your competitive set) who's earned an actual ADR & RevPAR of $362 and $255. The true score/ comparison then is that "Your Hotel" earned a $62 and $44
higher ADR and RevPAR then your neighbor. This is why you have deposited $700,000 more in your bank then he/she has!
Viewing your industry metrics would make you believe that "Your Hotel" and "Your Neighbors Hotel" were both performing at the same level. As an owner, a manager or a management company you would falsely be led to believe that you were taking market share here and at least performing at the same level as your direct competitor.
Industry metrics does not show you that "Your Hotels" channel mix was far superior to "Your Neighbors Hotel" channel mix and that, that enabled "Your Hotel" to deposit $700,000 more into the bank and also show $700,000 more in profit then your neighbor! That's the true tail of the tape!
The Optimization Score
The Optimization Scores shown (see Exhibit "A") are 88.9 and 83.1 for "Your Hotel" and "Your Neighbors Hotel", respectively. In the calculation used to arrive at SCORES we "grosses up" all merchant model channels by the commission withheld by the vendors. Once done, we can then add those results directly to other revenue channel cost. All channels are then on a level playing field of comparison.
Occupancy counts
Finally, since Optimization Scores must take occupancy success into consideration I've used a factor that corrects the total SCORE by your success level indicated by your occupancy. Having an extremely high ADR of $1,000, at face value, would seem to be great, but if on further examination your occupancy is at 33%...well that's not so good!!
The benchmark score of 88.9 above came from (1) your hotel overall combined revenue channel cost of 19.4% (2) in subtracting that cost from 100.0% (100.0% - 19.4%) we arrive at 80.6%, and then (3) multiplying that "revenue profit after channel cost percentage" by a factor that places a 70.5% occupancy achievement in a scoring range (see below) that is common. In this case 70.5% is multiplied by 1.103 to arrive at 88.9%.
100.0% less 19.4% - 80.6 multiplied by 1.103 = 88.9
The final step would be to use that 88.9 score as a benchmark and then compare it to your subsequent achievement scores. This would allow revenue managers to identify and improve hotel profitability by optimizing channel mix and the amount of merchant model business entertained. It also gives the Revenue Manager a way to show executive management the level to which his/her actions have contributed the the hotels bottom line!
If you wished to take this one step further, you could make this calculation monthly and examine month over month inroads to higher profitability.
Scoring Range
90%-100% elite!
80%-89% excellent
70%-79% good
60%-69% fair
50%-59% requires attention.
Richard B Evans
President of Revenue Report Card LLC
(954) 290 - 3567
