U.S. Hotel Owners Eyeing Interest Coverage
According to CBRE’s February 2023 Investment Performance forecast, total revenues for the average U.S. hotel returned to 2019 levels in 2022, but the recovery of hotel profits will be delayed until later this year. Hotel franchise and management companies have benefited the most from the ongoing revenue recovery because the fees they receive are frequently earned as a percent of revenue. However, for many hotel owners, along with their lenders and investors, the lag in the return of profits has been a hardship. Afterall, it is the profits of hotel operations that enable owners to pay their debt obligations and provide returns to their investors.
Based on an analysis of EBITDA [1] and interest expense data from CBRE’s Trends® in the Hotel Industry database, the combination of rising profits and reduced interest payments has enabled a growing number of hotels to cover their interest obligations in 2022, but is quickly becoming more challenging in the face of higher prevailing interest rates. To analyze the ability of U.S. hotel owners to pay their interest expense, CBRE studied a sample of 575 hotels that reported interest payments in their operating statements for the years 2019 through 2022. In 2022, these hotels averaged 167 rooms in size, an occupancy of 67.8%, an average daily rate of $168.60, and a RevPAR [2] of $114.31, versus the $113.71 RevPAR achieved in 2019. It should be noted that hotels unable to make any interest payments in 2020, 2021, or 2022 were excluded from this analysis.
Interest Coverage
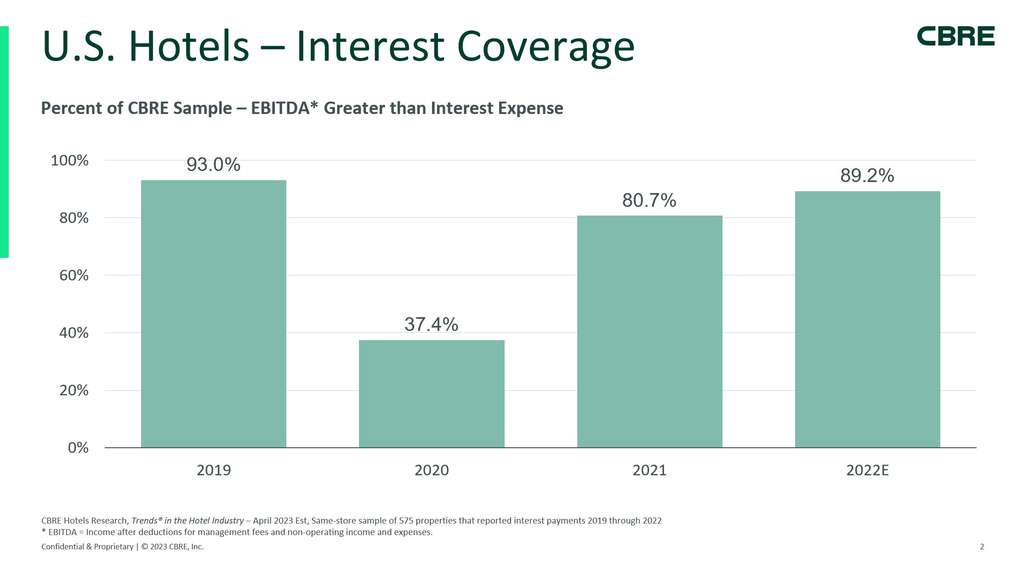
In 2019, 93.0% of the hotels in the study sample achieved an EBITDA level greater than their interest expense for the year. During 2019, the hotels in the sample achieved an average interest coverage ratio (EBITDA divided by interest expense) of 2.32x. Interest coverage ratios were greatest at limited-service hotels (2.52x), and lowest at resort properties (1.70x).
In 2020, during the depths of the industry recession created by COVID, the average interest coverage ratio dipped to 0.23x. During 2020, only 37.4% of the hotels in the survey sample generated enough cash from operations to cover their interest obligations, with extended-stay hotels fairing the best. For the remaining properties, owners had to call equity, dip into operating or capital improvement reserves, or negotiate a loan modification with their lender. On average, full-service and all-suite properties experienced the highest levels of distress during this period.
By 2022, 89.2% of the properties in the study sample were able to achieve an EBITDA greater than their interest expense, and the coverage ratio increased to 2.72x through a combination of improved performance paired with a favorable interest rate environment. While the average coverage ratio exceeds 2019 levels, the percent of properties able to meet their interest payment obligations fell short of 2019 results. This implies that a portion of the properties have achieved very strong recoveries and are more secure in their interest coverage than they were before COVID. However, not all properties that were able to cover their interest expense in 2019 had improved profits sufficiently to do so in 2022.
As has been well-documented, leisure travelers and remote workers have helped buoy the performance of resort hotels. The relatively strong recovery in both revenues and profits enabled 92.9% of the resort properties in the sample to generate an EBTIDA greater than interest expense in 2022. For the year, the average interest coverage ratio for resorts was a robust 3.70x. Resort metrics are not only greater than they were in 2019, but they are also the greater than the respective metrics for full-service, limited-service, all-suite, extended-stay and convention hotels in 2022.
Changes in Interest Expense
In combination with rising profits, we also observed a reduction in the average interest payment made by the hotels in our survey sample. From 2019 through 2022, average interest expense dropped from $6,192 per available room in 2019 to $5,921 in 2022, a decline of 4.4%. On average, the full-service and limited-service hotels in the sample benefited from a decline in interest expense from 2019 to 2022, while the other property types saw their interest expense increase.
The relative interest expense decline is due to a significant reduction in prevailing interest rates during this period. From the start of 2019 through March 2020, the Federal Reserve dropped the Federal Funds Rate (“FFR”) from 240bps to 5bps and held the FFR near zero until March of 2022. From March 2022 through the end of the year, the Federal Reserve reversed course and raised the FFR by 425bps, accounting for a rapid increase in debt service for properties that are leveraged with floating-rate debt. This is reflected in data from CoStar that indicates the average monthly hotel interest rate increased from 5.3% in 2019 to 7.2% by the end of 2022.
Future Requirements
CBRE’s February 2023 Investment Performance forecasts call for the average U.S. hotel to return to 2019 EBITDA levels in 2023. From there, CBRE is projecting an average 4.8% annual EBITDA growth rate through 2027. This is above the expected pace of inflation, a net positive for hotel owners. The lingering question is: ‘When will interest rates moderate?’ Given recent unrest stemming from the March bank failures, all eyes will be on the Federal Reserve and indications as to when they will begin to lower the FFR in the face of tightening financial conditions both domestically and abroad.
The good news for hotel owners is that there is currently ample liquidity in the debt capital markets, as lenders continue to favor hotels as an asset class, given the relative outperformance versus other property types. To that end, CBRE has been canvassing active lenders on behalf of our clients, successfully securing proceeds for recapitalizations, acquisitions and refinancings for performing and non-performing properties.


- [1] Earnings Before Interest, Taxes, Depreciation and Amortization.
- [2] Rooms Revenue per Available Room
Robert Mandelbaum
Director of Research Information Services
CBRE Hotels