Market Recovery Monitor - 10 September 2022
Based on the latest week of data (4-10 September 2022), and accounting for a holiday calendar shift, the 3-day Labor Day weekend (Friday – Sunday) in the U.S. was the second best behind 2021. For the three-day period, 12.1 million rooms were sold, which was 27,000 less than in 2021 and 79,000 more than in 2018, which was the previous Labor Day weekend record before last year. Additionally, from Wednesday to Saturday, the industry saw its highest demand for the post-Labor Day days. Despite the solid Labor Day finish, total weekly room demand fell 1.9% week on week (WoW) as the industry continued its seasonal slowdown. The week-on-week decline, however, was significantly less than in the years prior to the pandemic. Weekly occupancy reached 61.7%, which was down from 62.8% in the prior week. Nominal average daily rate (ADR) dropped 0.5% WoW to US$147, which was 15.2% higher than a year ago. Weekly nominal revenue per available room (RevPAR) decreased 2.3% WoW to US$91, its third straight week below US$100 but 24% better than in 2021. Accounting for the shift in the holiday, both real ADR and RevPAR were above 2019 (+5% and +6%, respectively).
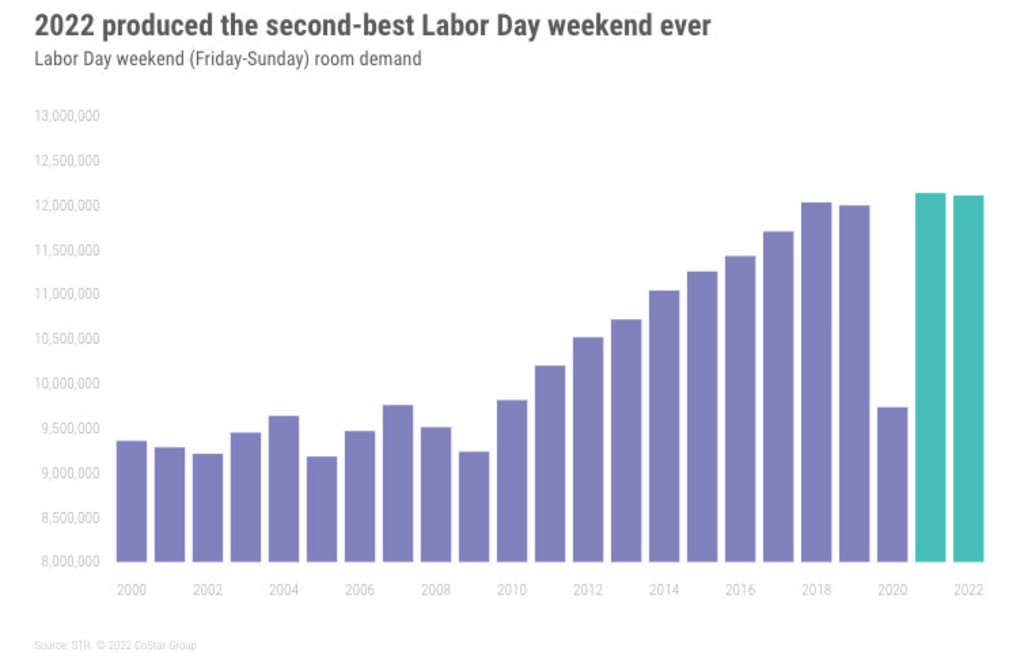

The days following the Labor Day holiday, adjusting for the shift over the years, had the highest demand for those post-holiday days going all the way back to 2000. In fact, if you compare against the previous 20 Labor Day through end-of-year periods, the Saturday of Labor Day 2022 was the third best. This continues to point to the strength of leisure demand despite high inflation, market turmoil, and increased economic uncertainty.
Business travel also appears to have rebounded somewhat after the holiday, too. Top 25 Market midweek (Wednesday & Thursday) occupancy increased to 65% from 61% in the prior week. Occupancy on those two days ranged from 89% in New York to 40% in New Orleans. Boston, Denver, Los Angeles, San Diego, and San Francisco all reported midweek occupancy, and occupancy was up in all but nine of the Top 25 Markets. For the full week, Top 25 Market occupancy fell 1.3 percentage points WoW to 64% given the normal weakness seen on the actual holiday and day after (Monday & Tuesday).
Like the Top 25, Central Business Districts (CBDs) saw midweek occupancy growth, reaching 64% after falling to 56% before the Labor Day holiday. Occupancy in Boston CBD increased to 90%, up 10 percentage points WoW. The New York Financial District also saw a sharp gain (+17 percentage points WoW) as occupancy neared 90%. Denver, Nashville, Seattle, and San Diego all reported midweek occupancy above 70%. However, not every CBD saw solid midweek occupancy, with New Orleans (34%) and Atlanta (45%) at the bottom. Six of the 20 CBDs saw midweek occupancy fall week over week. For the entire week, CBD occupancy reached 62%, which was down 0.7 percentage points WoW.
Driving some of the midweek gain was an increase in group business, where midweek demand reached a six-week high. Group demand in Boston, Los Angeles, New York, Orlando, Phoenix, San Diego, and Washington, D.C. saw significant week-on-week gains. More importantly, those markets saw their highest midweek group demand of the past five weeks, which bodes well for the remainder of the conference season.
Among the chain scales, midweek occupancy also jumped week to week. Adjusting for the holiday shift, lower-tier chain scales reported higher midweek occupancy in 2022 as compared to 2019 with the upper-tier lagging. Upper Upscale reported midweek occupancy of 64%, down 3 percentage points from the comparable week in 2019. Upscale, a favorite of transient business travelers, reported midweek occupancy of 66%, -0.5 percentage points versus 2019.


Weekly nominal ADR in the Top 25 Markets showed a sharp increase, rising 2% WoW versus the -2% WoW for all other markets. The Top 25 was led by New York City (+19%), Nashville (+10%), Phoenix (+9%) and Washington, D.C. (+8%). However, excluding NYC, Top 25 nominal ADR would have been down 1.3% WoW.
Midweek nominal ADR produced an even larger gain for the Top 25 Markets, +9% WoW versus -0.4% for all other markets. Eight of the Top 25 Markets reported midweek nominal ADR gains above 10%, led by NYC (+34%) and Washington, D.C. (+20%). Even without New York, midweek Top 25 Market ADR was up (+4% WoW). As compared with last year, nominal midweek Top 25 Market ADR was up 25%. Weekly real (inflation-adjusted) ADR was up 16% year on year.
Nominal weekly RevPAR was slightly positive for the Top 25 Markets (0.2%) as compared with the -4% decrease outside of those markets. Like ADR, the metric was driven by New York City (+25% WoW). Nashville also saw strong growth (+13% WoW).
Midweek nominal RevPAR for the Top 25 Markets showed significant week-on-week growth (+17%), led again by New York (+53% WoW) and 12 other markets that reported midweek RevPAR growth of greater than 10% WoW. Year-over-year growth was also impressive, up 48% for the entire Top 25 with real RevPAR up 37% YoY.
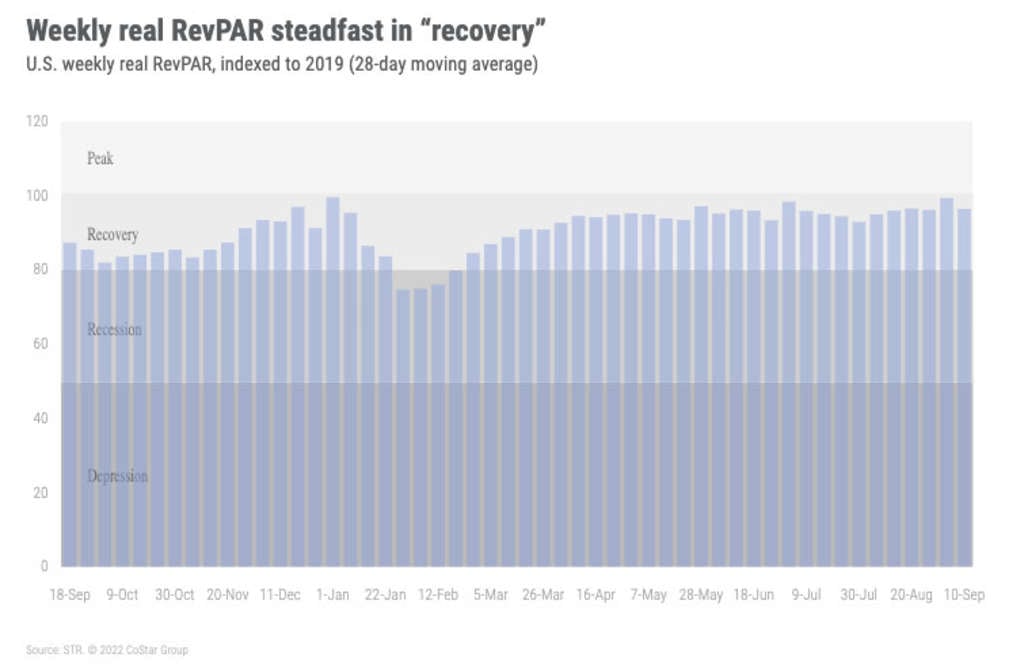
Over the past 28 days, and adjusting for inflation, 46% of U.S. markets were at “peak” RevPAR (real RevPAR above 2019) while another 48% were in recovery (real RevPAR between 80% and 100% of 2019).


Around the Globe
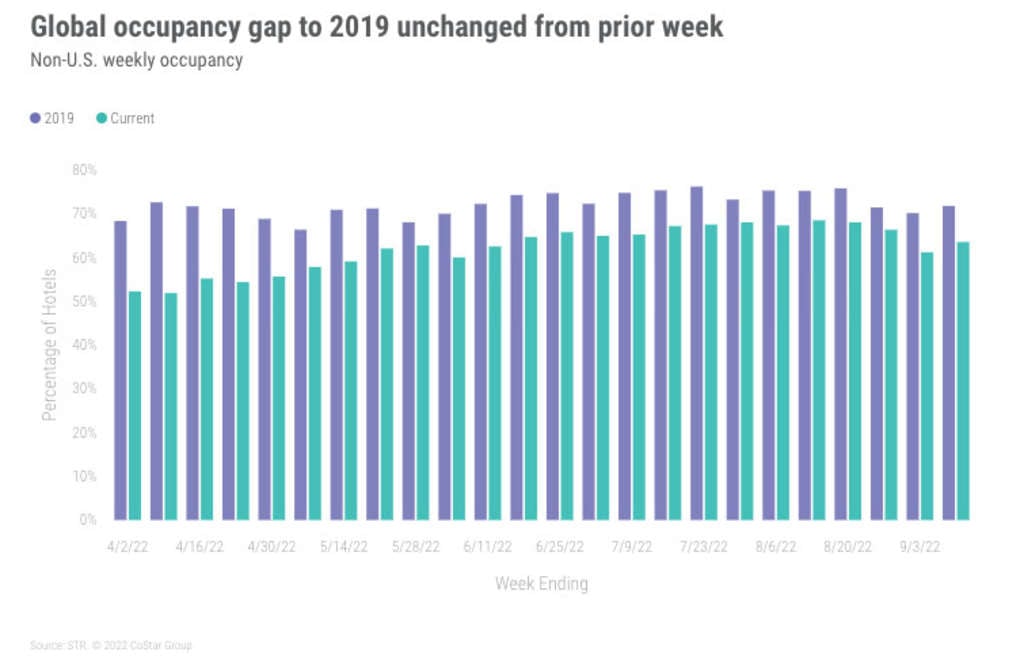
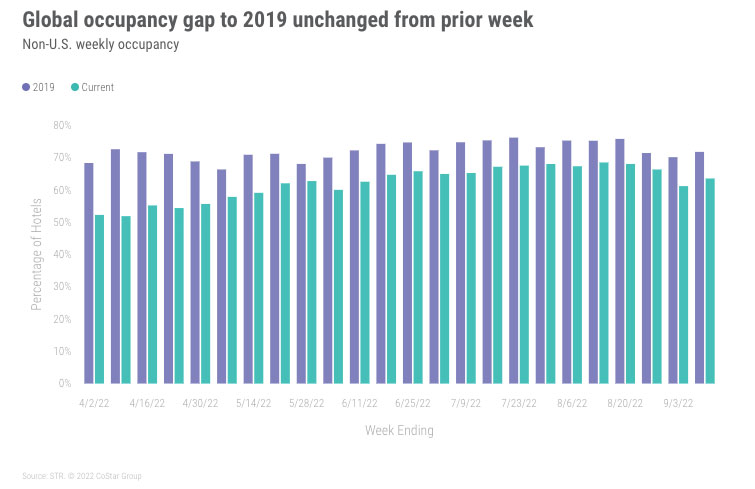
Outside of the U.S., occupancy increased 2.1 percentage points WoW to 63.8%. This was 7.8 percentage points behind the comparable week in 2019. ADR increased 4.2% WoW to US$136, which was 11.4% ahead of 2019 levels. Thirty of the countries tracked on a weekly basis saw a week-over-week drop in occupancy.
Italy reported a 13.1 percentage-point increase in occupancy compared with the previous week, coupled with a 14.5% WoW uptick in ADR. This was driven by the Italian Grand Prix, held in Milan. China saw occupancy fall to 48.2%, down 4.5 percentage points WoW with COVID-related restrictions in Guizhou, Guangzhou, and Shenzhen. Hamburg hosted SMM 2022, an in international trade fair for the maritime economy. While occupancy was flat WoW, ADR increased 30% from the previous week.
Ireland and Portugal reported the strongest occupancy levels (88% and 84%, respectively). Despite this, both came in behind 2019 levels by 3.1 and 5.5 percentage points, respectively. Northern Europe again saw the highest occupancy (80.6%) of any subcontinent, up 4.7 percentage points compared to last week, with Northeastern Asia with the lowest (49.9%)


Over the past 28 days, and adjusting for inflation, 18% of non-U.S. markets remained in “Recession” (real RevPAR indexed to 2019 between 50 and 80) with 2% in “Depression” (real RevPAR indexed to 2019 under 50).


Big Picture
This week was somewhat typical for the days after a major holiday. We were surprised and encouraged by the strong midweek performance, which we focused on, as we seek evidence of a solid fall led by pent-up group demand. We remain optimistic for the U.S. but are increasingly worried for areas outside the nation, given revised weaker economic forecasts. The U.S. economic forecast has also been downgraded, but we believe other factors (solid, upper income-led leisure demand, and pent-up group demand) will mitigate the effects of a slowing economy.
About STR
STR provides premium data benchmarking, analytics and marketplace insights for the global hospitality industry. Founded in 1985, STR maintains a presence in 15 countries with a corporate North American headquarters in Hendersonville, Tennessee, an international headquarters in London, and an Asia Pacific headquarters in Singapore. STR was acquired in October 2019 by CoStar Group, Inc. (NASDAQ: CSGP), the leading provider of commercial real estate information, analytics and online marketplaces. For more information, please visit str.com and costargroup.com.