US Hotel Occupancy Keeps Pace With Peak Summer 2021 Levels as Urban Markets Rebound
Hotels in New York City, San Francisco and Other Major Cities Report Significant Gains

The signs of summer are here for the U.S. hotel industry, and some of the nation’s top urban markets are showing consistent evidence of recovery.
Increased group and business travel, graduations, and elevated leisure trips drove solid hotel performance during the week of May 15-21, and the industry is gaining momentum for the summer months of peak leisure demand.
Occupancy in the U.S. reached 68.6% for the week, which was the highest level since July 2021. To add some perspective, since the start of the pandemic, weekly occupancy has only surpassed 65% on 17 occasions with seven of the occurrences happening this year and the remainder seen last summer. Furthermore, year-to-date occupancy is 60% versus 51% a year ago. Weekly average daily rate grew to $152, the third-highest level of the pandemic era and 13% higher than the comparable week of 2019. More importantly, revenue per available room reached $105, its highest level since the start of the pandemic.

For the second consecutive week, New York City led the nation in occupancy at 89.4%, powered by graduation ceremonies for Columbia University’s and New York University’s classes of 2020, 2021 and 2022. This was also the city’s highest occupancy of the pandemic era. In total, 18 markets reported their highest occupancy levels since the pandemic began, including San Francisco at 79%, Boston at 77.3%, Seattle at 76.2%, Washington, D.C., at 76.1%, Chicago at 71.5%, Philadelphia at 69.8%, and Minneapolis at 63.9%.
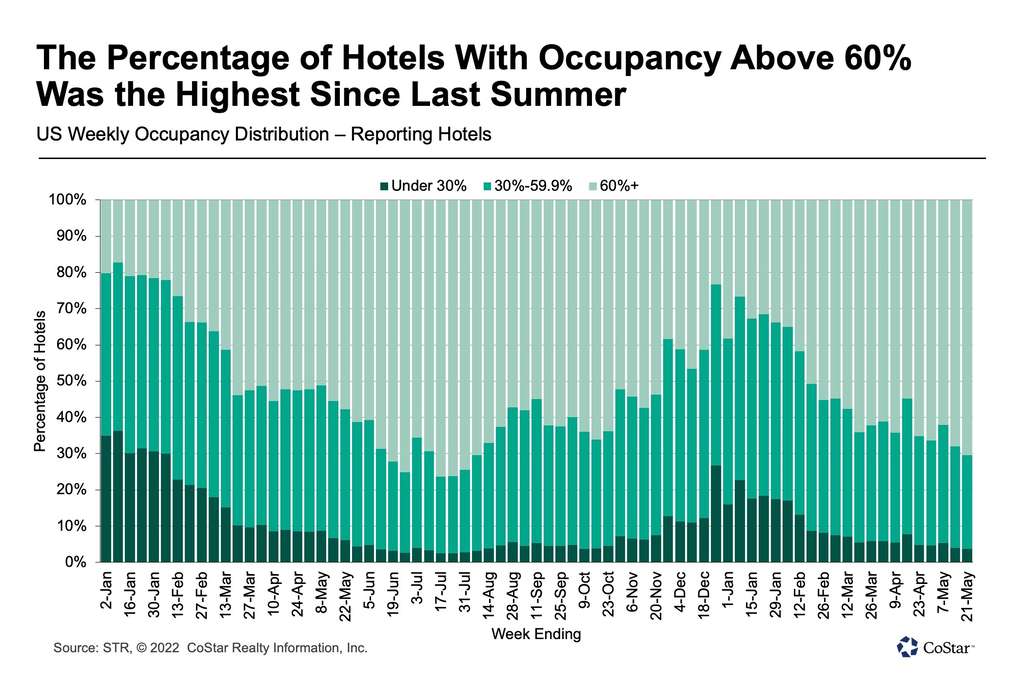
Seventy percent of reporting hotels saw occupancy surpass 60% during the week—the most since last summer. Of the 600 large hotels – with more than 300 rooms – in urban locations, 80% had weekly occupancy above 60%. Of those hotels, 42% reported occupancy above 80%, which was the most since the beginning of the pandemic.
Weekday occupancy from Monday to Wednesday, which is a barometer for business travel, increased to 67.2%; it was the highest of the year and the fourth highest since the start of the pandemic. Among the top 25 markets, weekday occupancy was 72.2% – the best since March 2020 – with group demand the second highest. The top 25 markets also saw their highest weekday ADR and RevPAR of the pandemic era, at $184 and $133, respectively. Eight of the top 25 markets, including New York City, Chicago, San Francisco, and Washington, D.C., also reported their highest weekday occupancy of the pandemic era led by NYC, at 91.1%, and San Francisco, at 82.7%. Fourteen of the top 25 markets saw weekday occupancy surpass 70%, the most since the pandemic began. Nearly half of large urban hotels reported weekday occupancy above 80%, which was again the most in the pandemic era.


Strong occupancy also prevailed in central business districts, where weekly occupancy topped 73%, which was the highest level of the past 27 months. Along with strong occupancy, ADR, at $244, and RevPAR, at $180, also reached pandemic highs. Five of the 20 central business districts tracked reported occupancy above 80%, led by the New York Financial District, at 92%, which we include with the 19 other central business district submarkets. Weekday central business district occupancy was the same as the weekly total with New York Financial District reaching 94%, which was the highest level for the submarket since late 2019. Thinking of business demand through the chain-scale lens, luxury (72.2%), upper upscale (72.3%) and upscale (74.6%) hotels reported their highest occupancy since the start of the pandemic.


Group demand strengthened among luxury and upper-upscale hotels, and this week, group demand was the second best of the pandemic era. This was the fourth week of elevated group demand with the weekly total at 97% of the comparable week of 2019. Weekday group demand was 86% of 2019’s level with weekend group demand surpassing 2019 by 22%. Group RevPAR also surpassed 2019 for the second time, however this most recent week’s level was more significant given its high volume. When group demand previously surpassed 2019, the volume was low and based on holiday groups.
Weekend occupancy was 77.8%, which was the second best of the year and the 12th highest of the pandemic era. Again, New York City led the nation with the highest weekend occupancy at 91.2% followed by Long Island. While occupancy was not a record, weekend RevPAR reached $131, which was a pandemic-era high as ADR was the second best.
Leading indicators point to another strong week ahead of the Memorial Day holiday in the U.S. TSA security screenings for the seven days ending Thursday, May 26, were at 93% of the pre-pandemic comparable, which is the highest seven-day percentage of the pandemic era. As was said at the Hunter Hotel Investment Conference all the way back in March, this summer is on the verge of being “the summer of summers.”
Pricing and Inflation
Nominal average daily rate remained strong with this week’s result 13% above the comparable level from 2019 and the third highest of the pandemic era. Week on week, hotel room prices increased 2.2%, the largest gain of the past six weeks. The top 25 markets reported their highest ADR of the era at $184, as did central business districts at $244 along with upscale ($159) and upper-midscale hotels ($131).
Inflation has increased by about 13% this year as compared with the same period in 2019. Forty-five percent of hotels that were open in 2019 and are still open today reported ADR growth that was above the rate of inflation with 28% seeing ADR growth of more than 20% from 2019. However, there are still hotels that are suffering. Twenty-five percent saw lower ADR when compared to the same week in 2019. On an inflation-adjusted basis, real industrywide ADR was essentially at 2019’s level and has been there or above 2019 for the past 10 weeks.


Nominal revenue per available room was the highest it has been since the start of the pandemic in nearly every cut of the data. Therefore, it is not surprising that 79% of the 166 STR-defined markets were in the “peak” category – with RevPAR indexed to 2019 above 100 – with the remaining markets, except one, in “recovery,” or RevPAR indexed to 2019 between 80 and 100. On an inflation-adjusted basis, 41% of markets were in “peak” with 53% in “recovery.” Taking a longer view with rolling 28 days data, 37% of markets had real RevPAR at “peak” with another 53% in “recovery.”
Isaac Collazo is VP Analytics at STR.
This article represents an interpretation of data collected by CoStar's hospitality analytics firm, STR. Please feel free to contact an editor with any questions or concerns. For more analysis of STR data, visit the data insights blog on STR.com.